

2022
-
NASDAQ Sideways but still off the top of the Channel Down
- June 6, 2022
- Posted by: Tradingshot Articles
- Category: Stock Indices
No Comments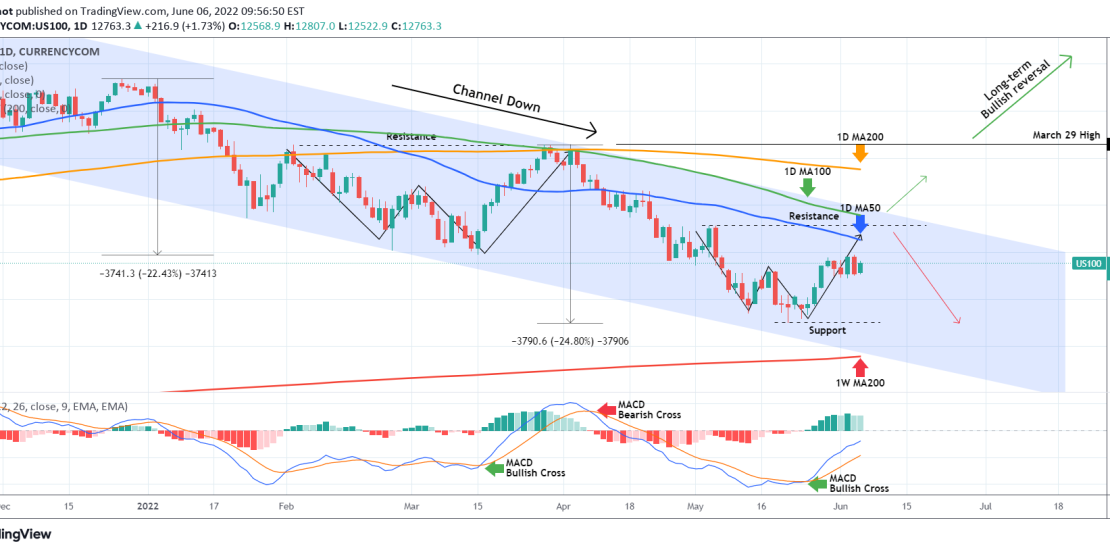
Nasdaq (NDX) has been trading sideways since May 30. The 1D MA50 (blue trend-line) is right above with the 1D MA100 (green trend-line) being roughly around the Lower Highs (top) trend-line of the Channel Down. Based on our previous analysis 2 weeks ago, the index was on a W pattern aiming at the Resistance
-
DOW JONES Consolidating below the 1D MA50 for a week
- June 6, 2022
- Posted by: Tradingshot Articles
- Category: Stock Indices
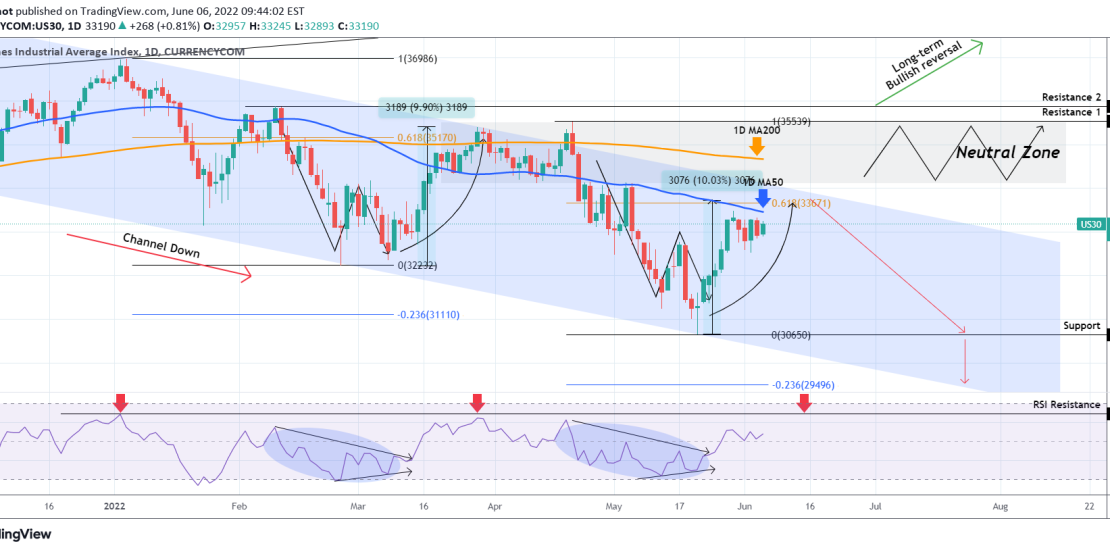
Dow Jones (DJI) eventually rebounded at the bottom (Lower Lows trend-line) of its long-term Channel Down, since our last analysis that indicated a sold R/R ratio for going long: Since the end of May though, the index has failed just before a 1D MA50 (blue trend-line) test and turned sideways below that level. This
-
XAUUSD Still bearish unless this level breaks
- June 6, 2022
- Posted by: Tradingshot Articles
- Category: Commodities
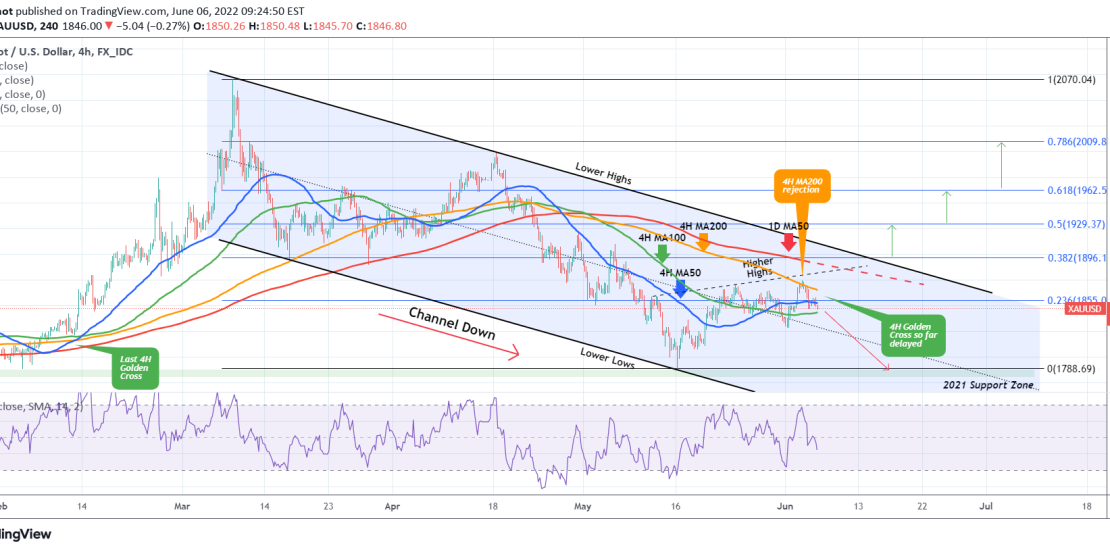
Gold (XAUUSD) has established a Channel Down pattern since its March 08 peak during the Ukraine – Russia war. Since May 16 it has been forming its new leg to a Lower High but three sessions ago it got rejected on the 4H MA200 (orange trend-line), cutting the uptrend from a 1D MA50 test
-
EURUSD Testing the Lower Highs of the 4 month Channel Down
- June 6, 2022
- Posted by: Tradingshot Articles
- Category: Forex
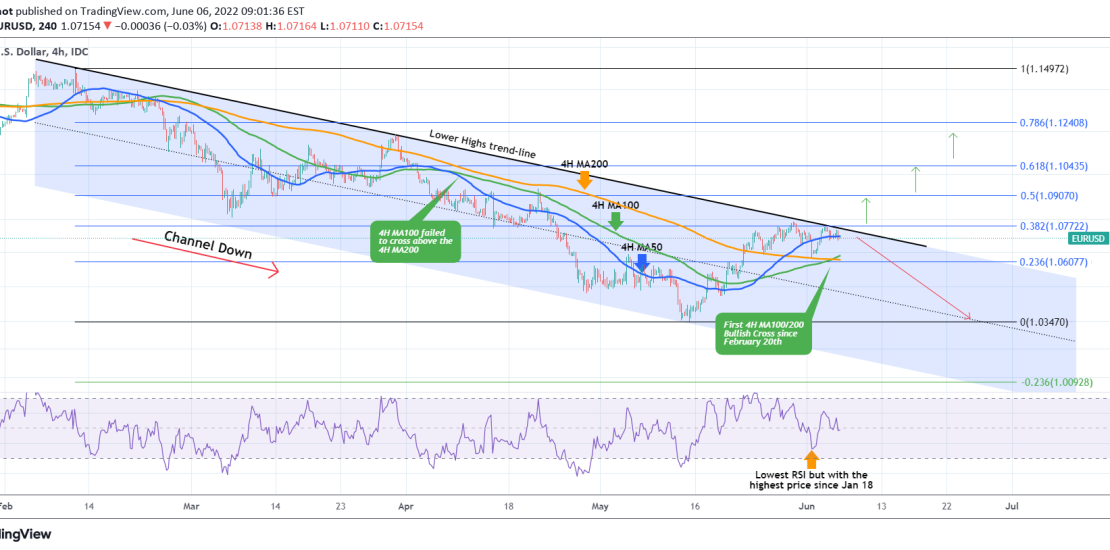
The EURUSD pair has been trading near the Lower Highs (top) trend-line of the 4 month Channel Down for the past 5 days. During this time the price tested the 4H MA200 (orange trend-line) as a Support and held. The longer it does, the stronger the buyer accumulation for breaking above the Lower Highs
-
MANAUSDT Bearish unless this level breaks
- June 3, 2022
- Posted by: Tradingshot Articles
- Category: Cryptocurrency
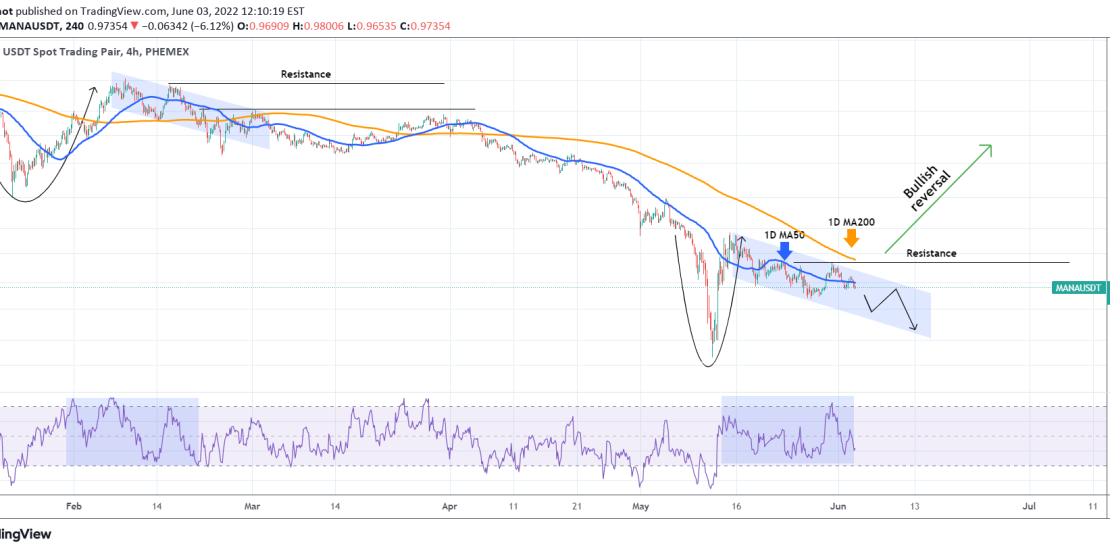
*** *** For this particular analysis on DECENTRALAND we are using the MANAUSDT symbol on the Phemex exchange. *** *** The idea is on the 4H time-frame where Mana has been trading within a Channel Down since the May 14 High. That is still a Lower High within the general bearish trend and the
-
BNBUSD Long-term action plan
- June 2, 2022
- Posted by: Tradingshot Articles
- Category: Cryptocurrency

The Binance Coin (BNBUSD) has been consolidating with the 1W MA100 (yellow trend-line) as its Support ever since the May 12 bottom and subsequent rebound. On a 1 year basis this is the ultimate range with the 705.00 Resistance and the 209.00 Support each being tested twice. There is a strong similarity between this
-
AUDJPY forming a bullish pattern
- June 2, 2022
- Posted by: Tradingshot Articles
- Category: Forex
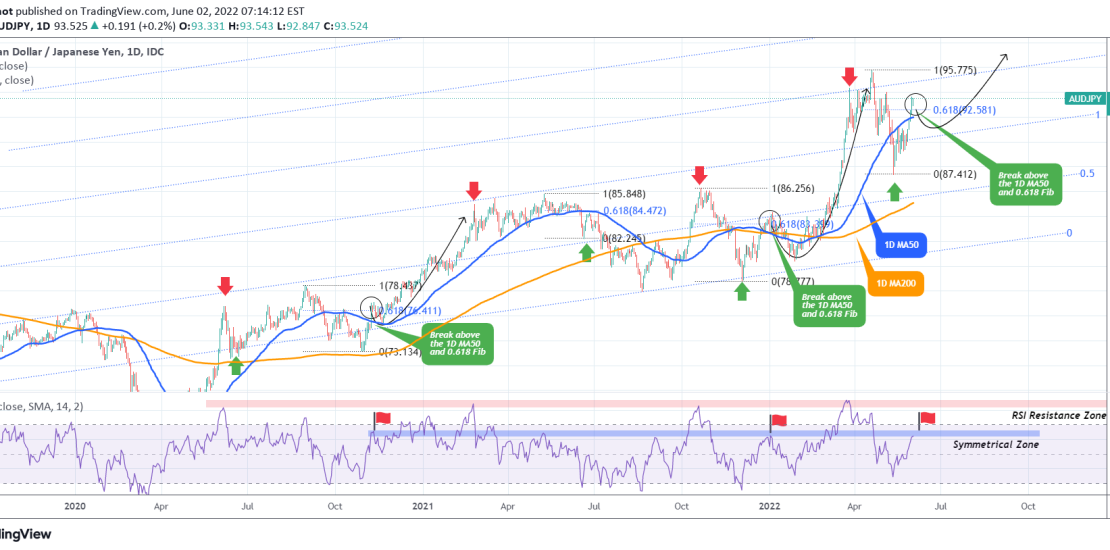
This is an update of the AUDJPY pair on my previous sell signal upon the 1D RSI Resistance rejection, as illustrated below: With the price now recovered from the sub 88.000 level, the pair is waving a buy signal as it broke above both the 1D MA50 (blue trend-line) and the 0.618 Fibonacci retracement
-
INFLATION testing a 100 year old trend-line. How will S&P react?
- June 2, 2022
- Posted by: Tradingshot Articles
- Category: Other, Stock Indices
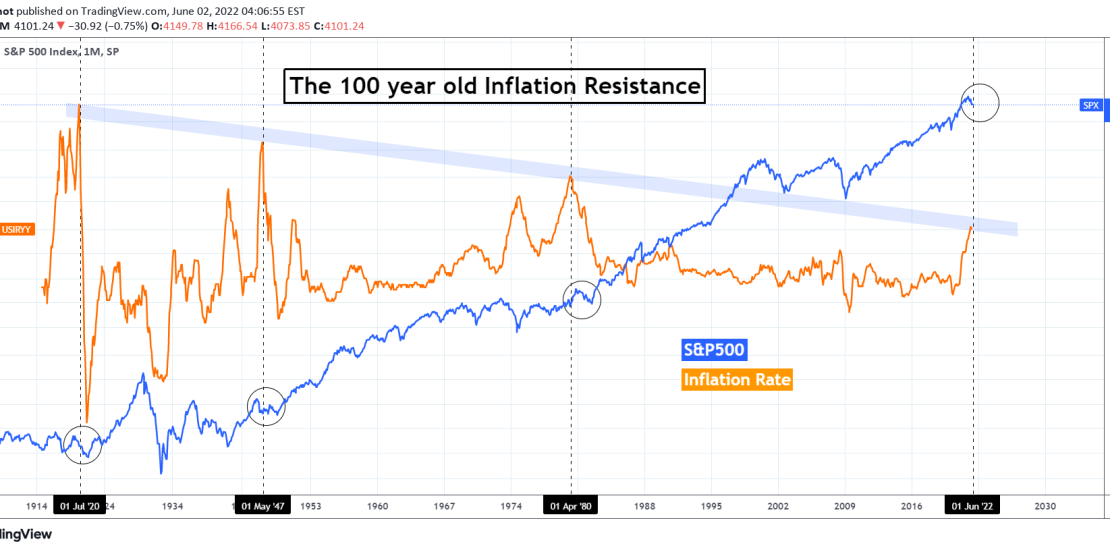
This is an interesting analysis as the U.S. Inflation Rate (orange trend-line) is testing for the first time since early 1980 a Lower Highs trend-line that started after the High of July 1920, exactly 100 years ago! This Lower Highs trend-line has made another 2 contacts after that and it is interesting to see
-
DXY Testing the RSI Support that started the 2021/22 rally
- May 31, 2022
- Posted by: Tradingshot Articles
- Category: Forex
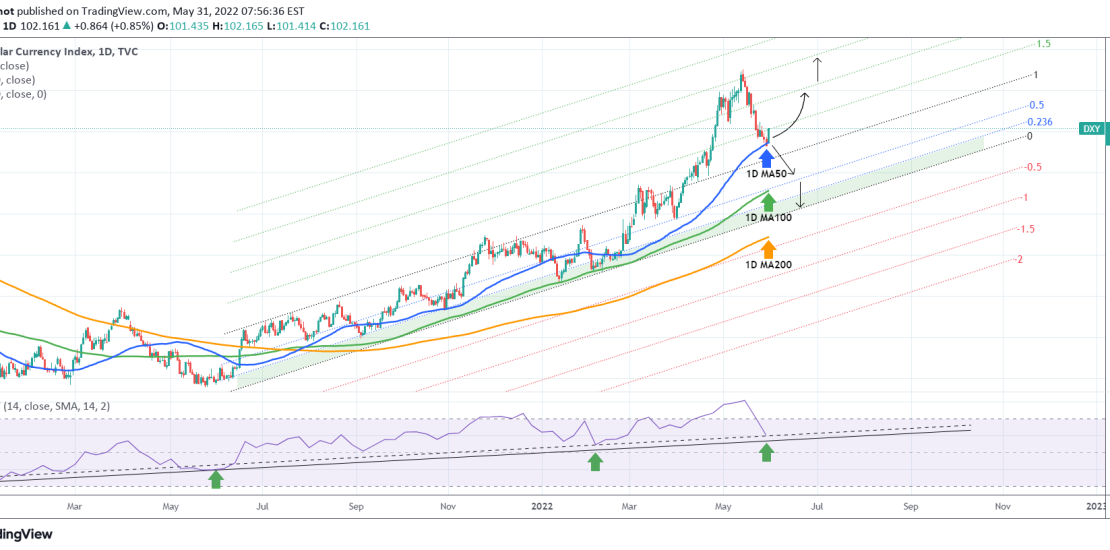
The U.S. Dollar Index (DXY) hit yesterday the 1D MA50 (blue trend-line) for the first time since February 23. Today’s rebound simply shows why this MA level is considered such an important short/ medium-term Support. As long as it holds, expect a rebound to the upper Fibonacci extension levels of 2.0 and 2.5 that
-
EURUSD hit the top of its 4 month Channel Down
- May 31, 2022
- Posted by: Tradingshot Articles
- Category: Forex
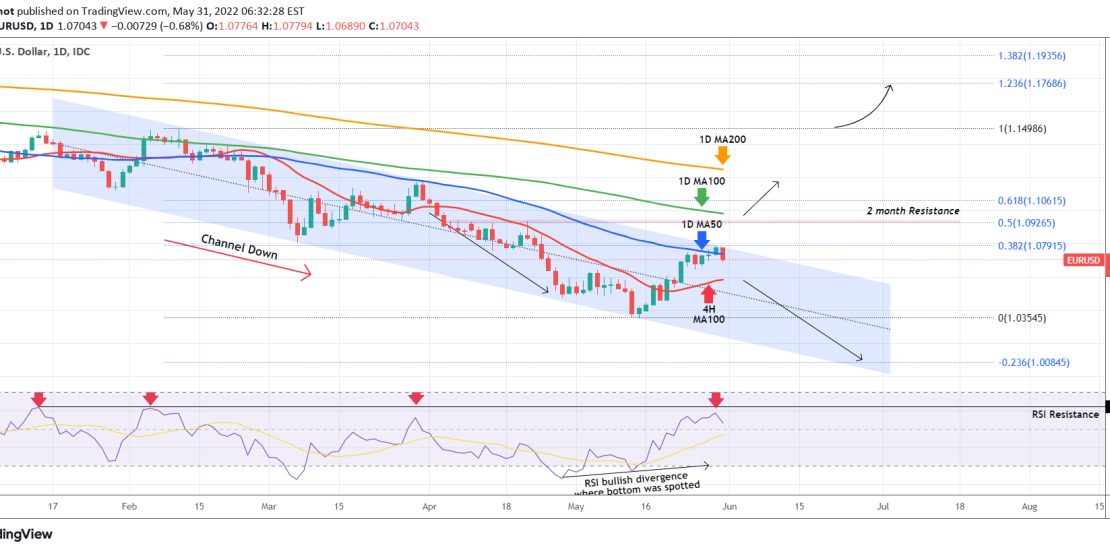
The EURUSD pair has been trading within a Channel Down pattern since early February. This was clearly analyzed two weeks ago on the idea below where the 1D RSI Bullish Divergence (Higher Lows against the price’s Lower Lows) helped us take the best possible buy trade: The price not only broke and closed above