

- June 2, 2022
- Posted by: Tradingshot Articles
- Category: Forex
This is an update of the AUDJPY pair on my previous sell signal upon the 1D RSI Resistance rejection, as illustrated below:

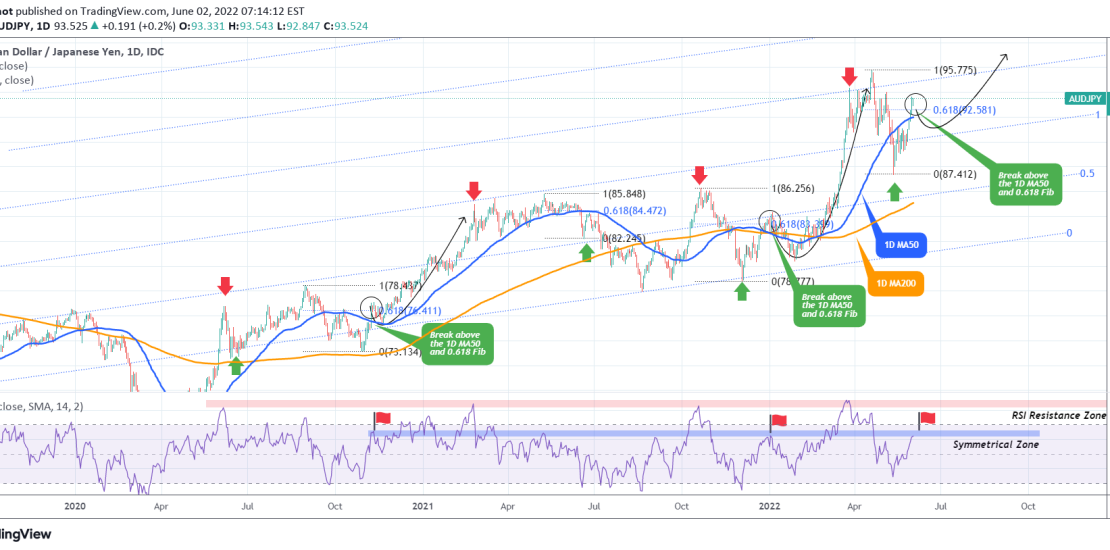
With the price now recovered from the sub 88.000 level, the pair is waving a buy signal as it broke above both the 1D MA50 (blue trend-line) and the 0.618 Fibonacci retracement level. Since it started trading on this long-term Fibonacci Channel back in 2020, this break-out combination has only happened twice (see the circles) and on both cases after a short-term pull-back, the price rallied strongly. For example see late June 2021, where the price failed to break above the 1D MA50 and 0.618 Fib.
Consider also the important of the 1D RSI Symmetrical Zone. The RSI is now exactly on the same level (flag symbol) that it was during those two break-outs I mentioned (mid November 2020 and early January 2022). This further suggests that we may be replicating currently that exact same bullish pattern.
Tradingview link:
https://www.tradingview.com/chart/AUDJPY/VcFWKKjE-AUDJPY-forming-a-bullish-pattern