

- June 6, 2022
- Posted by: Tradingshot Articles
- Category: Stock Indices
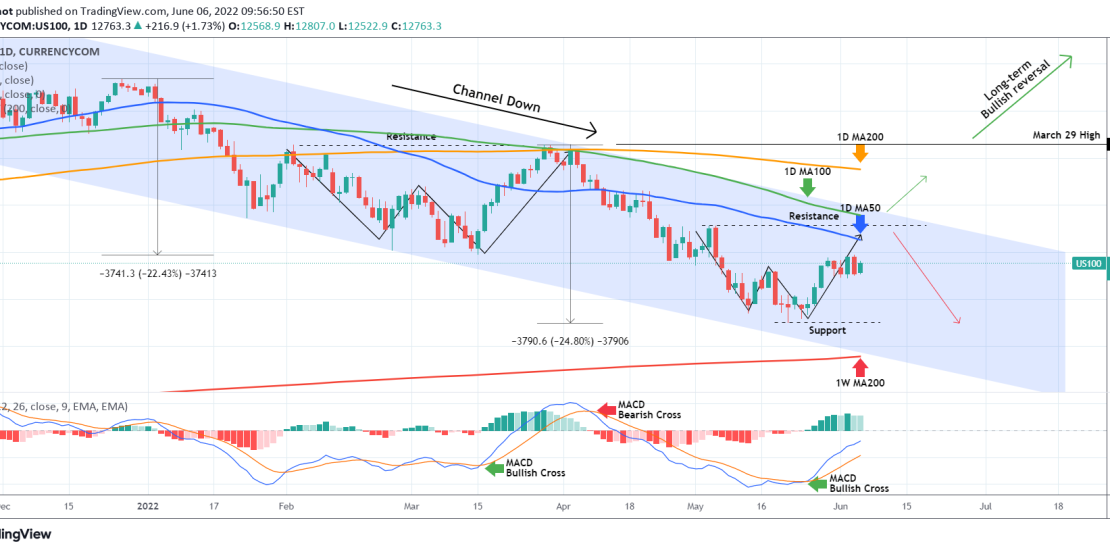
Nasdaq (NDX) has been trading sideways since May 30. The 1D MA50 (blue trend-line) is right above with the 1D MA100 (green trend-line) being roughly around the Lower Highs (top) trend-line of the Channel Down.
Based on our previous analysis 2 weeks ago, the index was on a W pattern aiming at the Resistance as part of the Lower Highs formation:

So far so good if you took that buy, you may start taking profit at will. The reason is that only a break above the 1D MA100 can justify further buying and that’s only to the 1D MA200 (orange trend-line), which last time rejected the uptrend from March 29 to April 05. Until the Lower Highs break, the trend is bearish towards the 11500 Support. A confirmed sell if you are looking for a lower risk factor, would be when the MACD makes a Bearish Cross.
As for a long-term bullish reversal only a weekly candle closing above the 15300 March 29 High can sustain it.
Tradingview link: