2019 August
-
USDSEK (Lower) Buy Signal
- August 30, 2019
- Posted by: Tradingshot Articles
- Category: Uncategorized
No Comments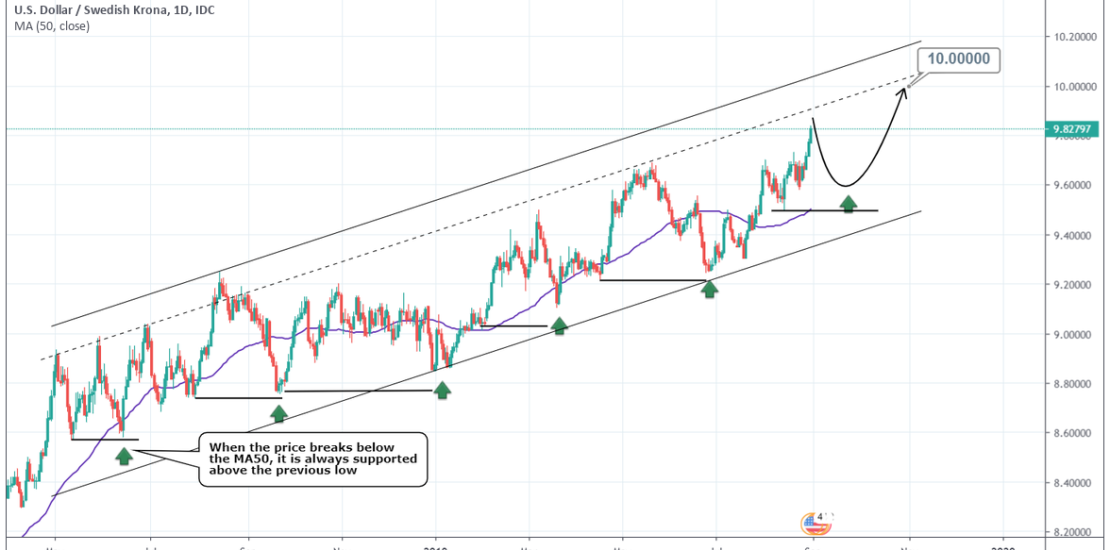
Pattern: Channel Up on 1W. Signal: Bullish but wait for a lower entry as the price is approaching the Higher High zone. The optimal buy entry will be when it crosses again the 1D MA50 (projected around 9.60000). Every time the price broke below the MA50, it always stayed supported above the previous low. Tradingview
-
GBPCAD Buy Signal (Long term)
- August 30, 2019
- Posted by: Tradingshot Articles
- Category: Uncategorized
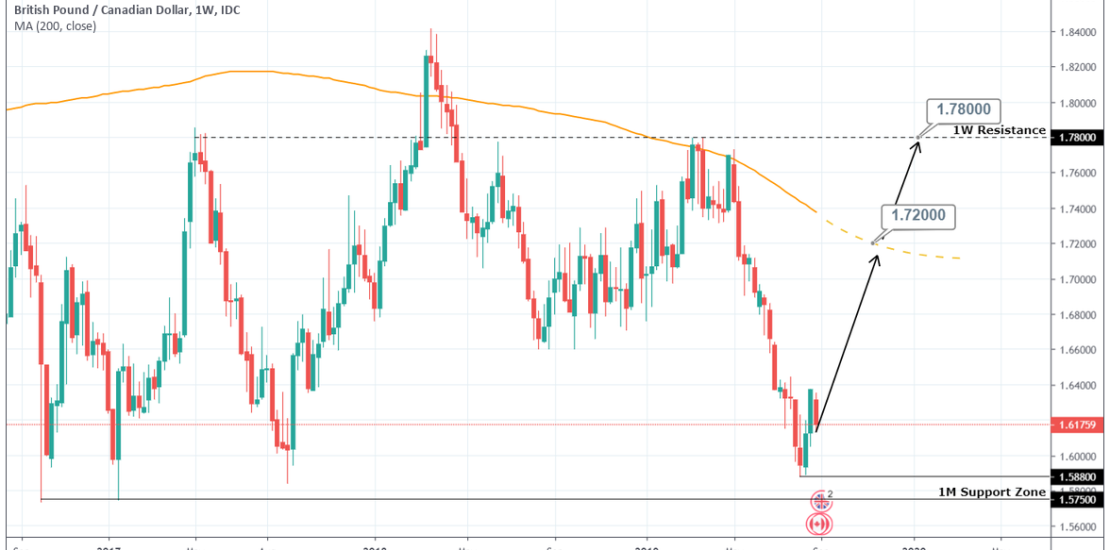
Pattern: Channel Down on 1W. Signal: Bullish as the price rebounded on the 1M Support Zone. Target: 1.72000 (projected contact with the 1W MA200) and 1.78000 in extension (1W Resistance). Tradingview link: https://www.tradingview.com/chart/GBPCAD/VcYFOd5o-GBPCAD-Buy-Signal-Long-term
-
DAX Buy Signal
- August 29, 2019
- Posted by: Tradingshot Articles
- Category: Stock Indices
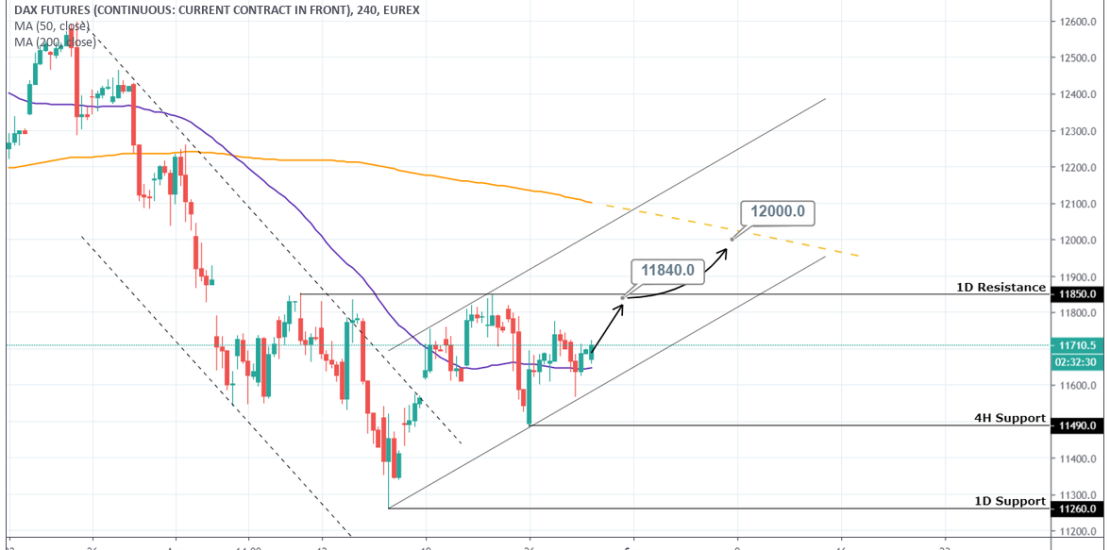
Pattern: Potential Channel Up on 1D emerging. Signal: Bullish after the pattern made successive Higher Lows. Target: Short term = 11840 (Just below the 1D Resistance), Medium term = 12000 (potential contact point with the 4H MA200). Tradingview link: https://www.tradingview.com/chart/FDAX1!/AYFuTqcB-DAX-Buy-Signal
-
WANUSD Sell Signal
- August 28, 2019
- Posted by: Tradingshot Articles
- Category: Uncategorized
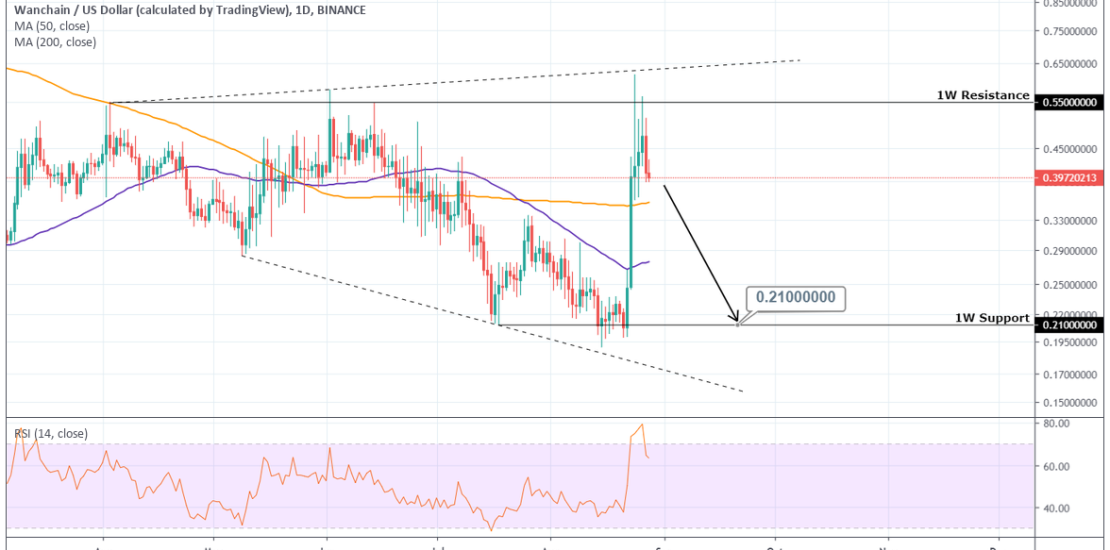
Pattern: 1W Bearish Megaphone. Signal: Bearish as the price was rejected on the Higher High and just above the 1W Resistance. Target: 0.21000 (the 1W Support). Tradingview link: https://www.tradingview.com/chart/WANUSD/l0QfKyV8-WANUSD-Sell-Signal
-
SGDHKD Buy Signal
- August 28, 2019
- Posted by: Tradingshot Articles
- Category: Uncategorized
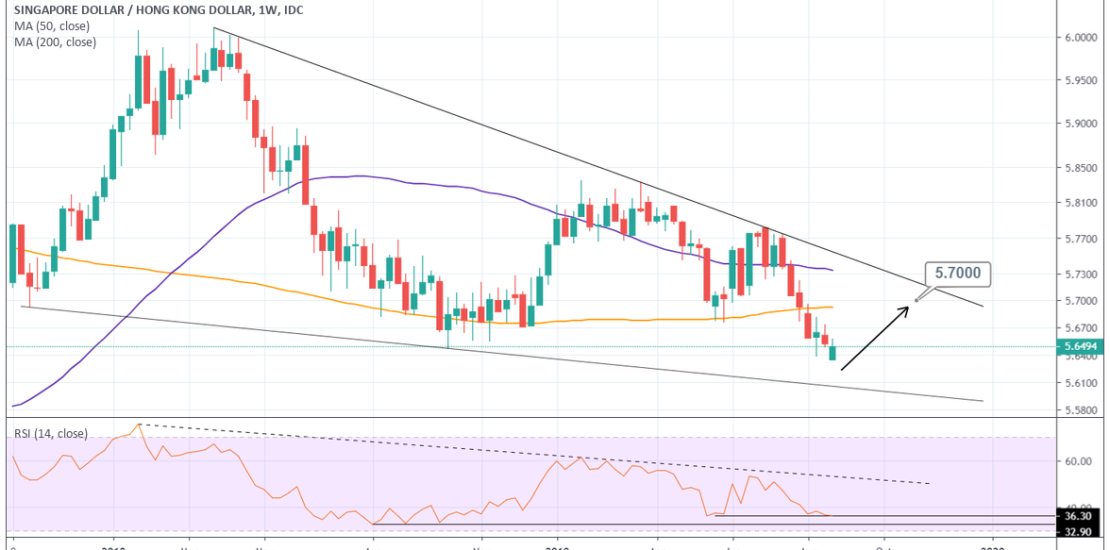
Pattern: 1W Falling Wedge. Signal: Bullish as the price is approaching the Lower Low zone and the RSI is on bottom levels. Target: 5.7000. Tradingview link: https://www.tradingview.com/chart/SGDHKD/p94X9zB9-SGDHKD-Buy-Signal
-
COPPER Long term sell signal
- August 27, 2019
- Posted by: Tradingshot Articles
- Category: Uncategorized
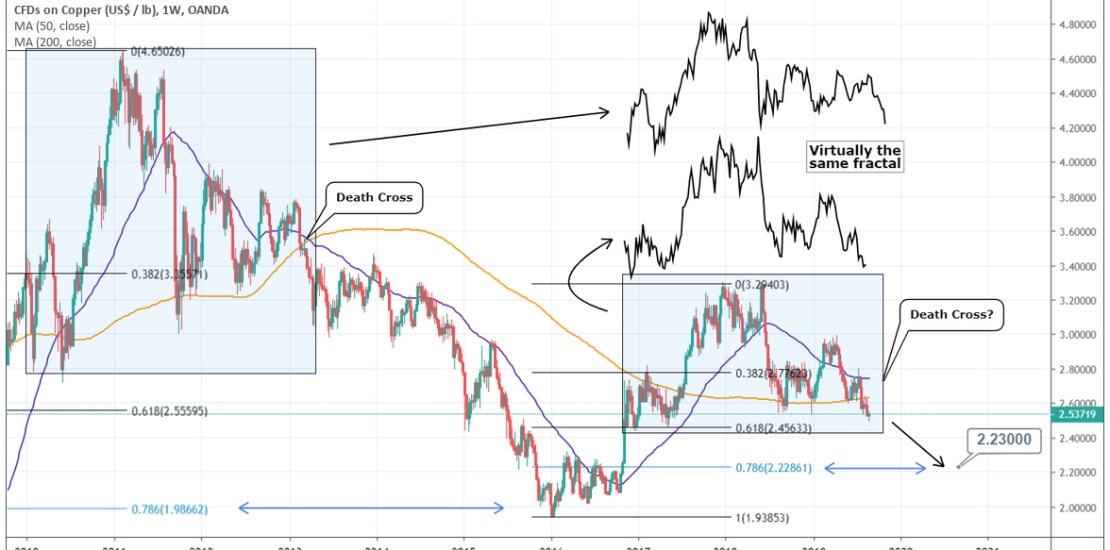
Same fractal detected that previous led to testing the 0.786 Fibonacci retracement level. Confirmation comes with the Death Cross occurrence. Long term target 2.2300 (new 0.786 Fib). Tradingview link: https://www.tradingview.com/chart/XCUUSD/6039NdSI-COPPER-Long-term-sell-signal
-
USDJPY Buy Signal
- August 23, 2019
- Posted by: Tradingshot Articles
- Category: Uncategorized
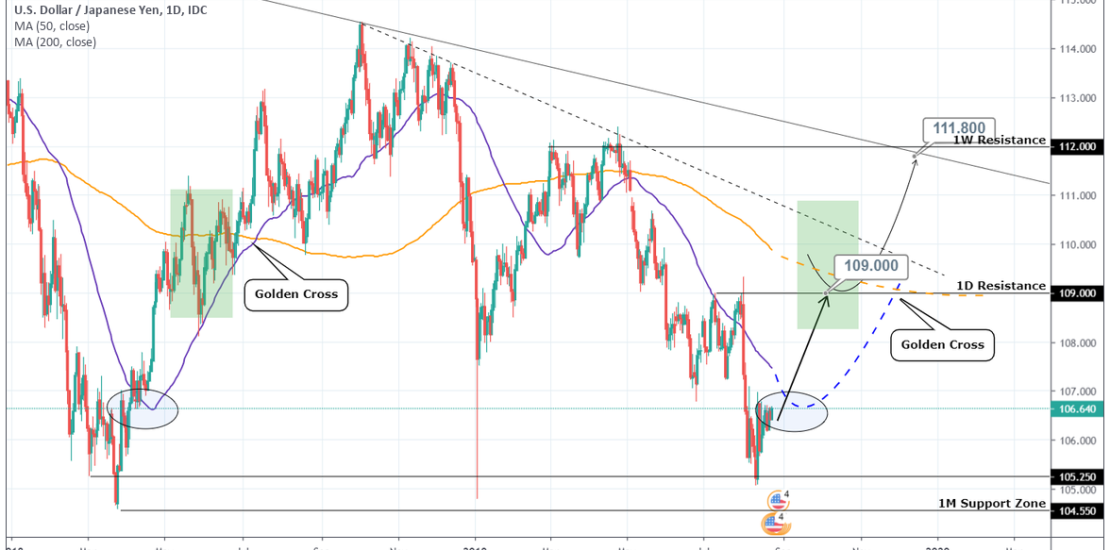
Pattern: Descending Triangle on 1M. Signal: Bullish as the price made contact with the 1M Support Zone. Target: 109.000 (the 1D Resistance). For risk seekers, if the Golden Cross (MA50 over MA200) takes place on 1D (as seen on the chart) it can extend towards the 112.00 1W Resistance. Tradingview link: https://www.tradingview.com/chart/USDJPY/2hYpnx51-USDJPY-Buy-Signal
-
CHFSGD Long term Sell Signal
- August 19, 2019
- Posted by: Tradingshot Articles
- Category: Uncategorized
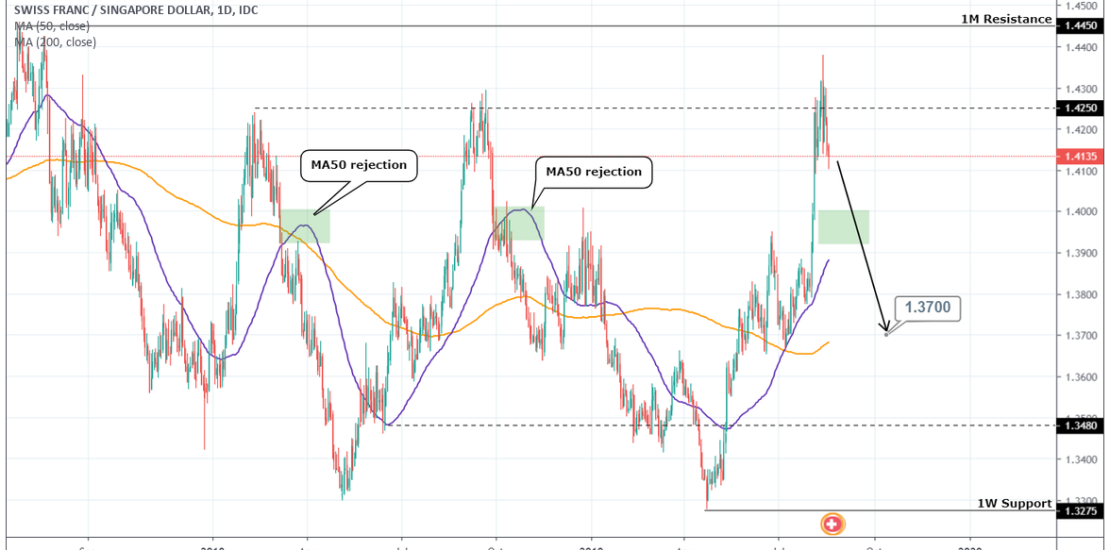
Pattern: Channel Down on 4H. Signal: Bearish long term as the price was rejected within the 1M Resistance Zone. Target: 1.3700 (contact with the 1D MA200). Tradingview link: https://www.tradingview.com/chart/CHFSGD/Sjyl10fV-CHFSGD-Long-term-Sell-Signal
-
S&P Buy Signal
- August 13, 2019
- Posted by: Tradingshot Articles
- Category: Uncategorized
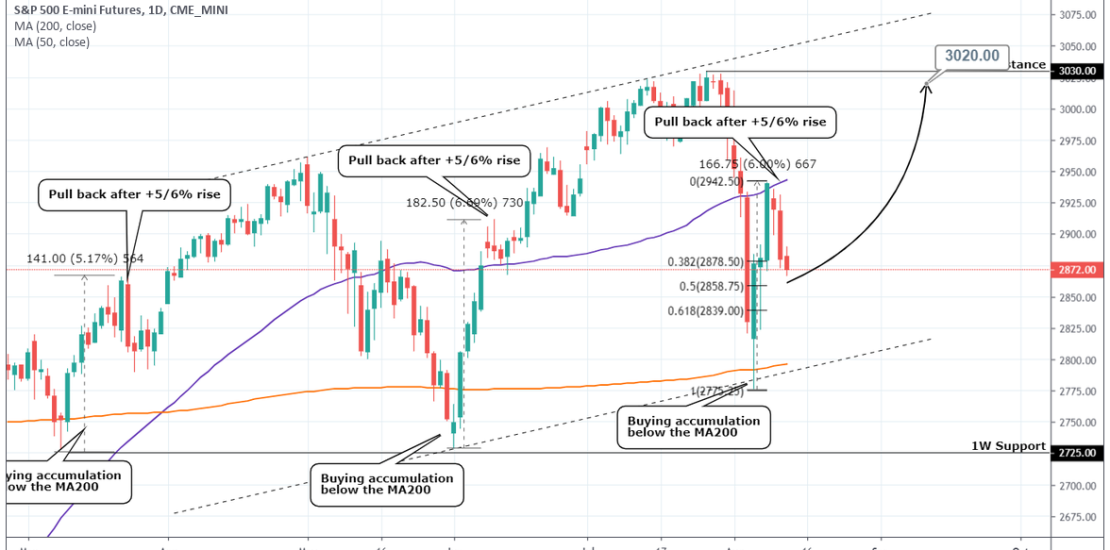
Pattern: Channel Up on 1W. Signal: Bullish as last week’s Higher Low rebound pulled back to the 0.382 – 0.5 Fibonacci retracement zone. Target: 3020 (just below the 1W Resistance). Tradingview link: https://www.tradingview.com/chart/ES1!/YaKuRfug-S-P-Buy-Signal
-
EURRUB Sell Signal
- August 13, 2019
- Posted by: Tradingshot Articles
- Category: Uncategorized
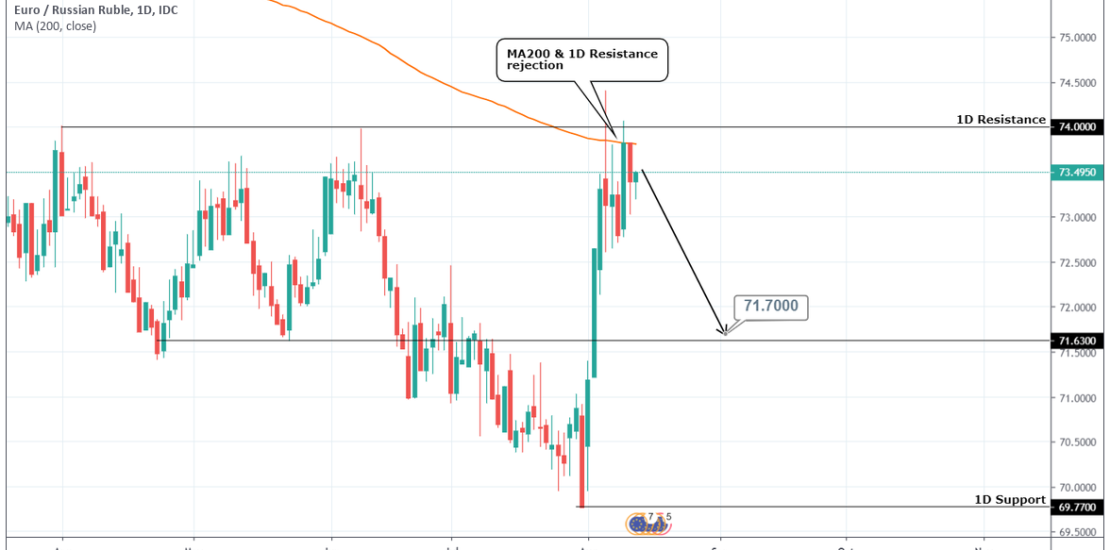
Pattern: Support/ Resistance trading. Signal: Bearish as the price hit both the 1D Resistance and MA200. Target: 71.700. Tradingview link: https://www.tradingview.com/chart/EURRUB/WaBEIvOL-EURRUB-Sell-Signal
- 1
- 2

