

- May 31, 2022
- Posted by: Tradingshot Articles
- Category: Forex
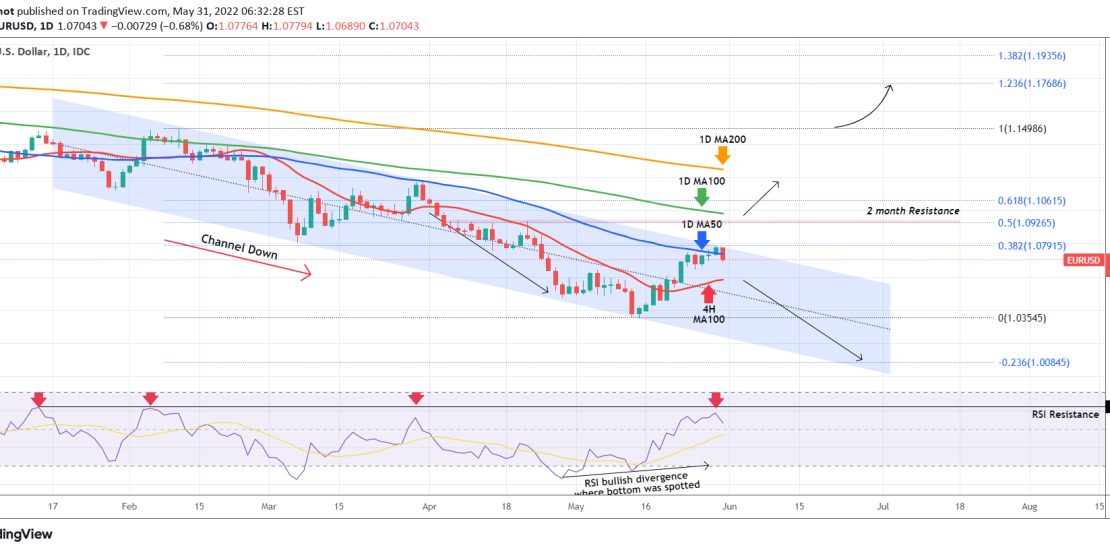
The EURUSD pair has been trading within a Channel Down pattern since early February. This was clearly analyzed two weeks ago on the idea below where the 1D RSI Bullish Divergence (Higher Lows against the price’s Lower Lows) helped us take the best possible buy trade:

The price not only broke and closed above the 1D MA50 (blue trend-line) yesterday for the first time since February 17, but also reached the top (Lower Highs trend-line) of the Channel Down, which as you see happens to be exactly on the 0.382 Fibonacci retracement level.
Technically, today’s rejection is justified as the new Lower High of the pattern. If the price breaks and closes below the 4H MA100, I expect the bearish trend within the Channel Down to be extended and go for a Lower Low near the -0.236 Fibonacci extension.
Even if it breaks though above the Channel Down, I believe that a confirmed break-out buy can be done only above the 1.09450 2 month Resistance level, which happens to be on the 0.5 Fib retracement level and just below the 1D MA100 (green trend-line). In this case, we can target the 1D MA200 (orange trend-line) on a short-term trade.
P.S. Notice also the 1D RSI Resistance level of 62.30. A break above it may possibly indicate the shift from long-term bearish to a long-term bullish trend.
Tradingview link:
https://www.tradingview.com/chart/EURUSD/nlphuG0r-EURUSD-hit-the-top-of-its-4-month-Channel-Down