2019 June
-
BITCOIN What will be the Rate of Return on this bull cycle?
- June 25, 2019
- Posted by: Tradingshot Articles
- Category: Cryptocurrency
No Comments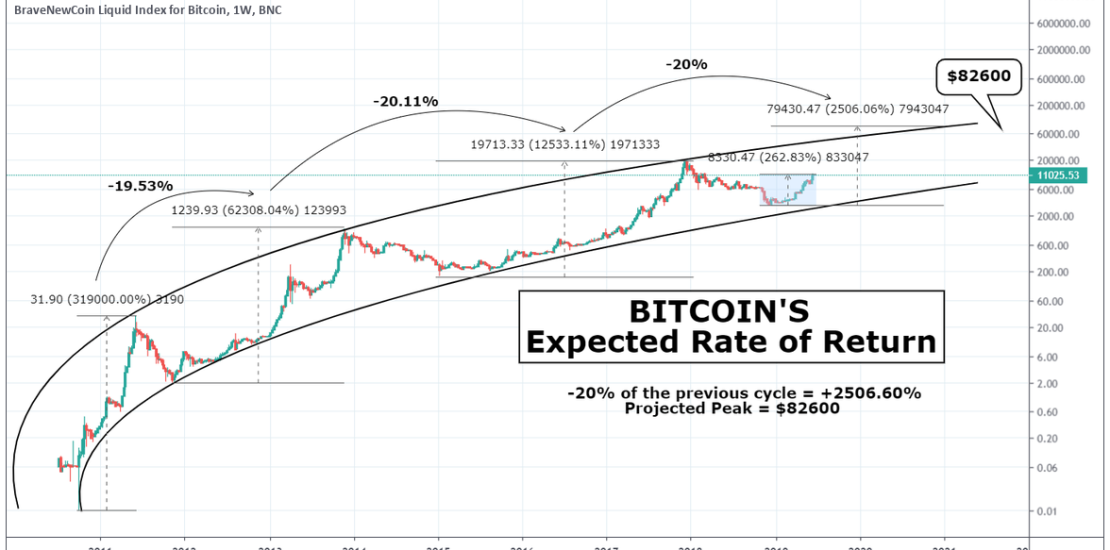
Traders and investors are looking for the highest possible rate of return when trading Bitcoin, especially after a better than expected start in 2019 to the new bull market. I tried to estimate the expected Rate of Return on the current bull cycle based on BTC’s historical logarithmic curve. It is easy to realize at
-
How many BTC will it take to buy 1 ounce of Gold in the future?
- June 24, 2019
- Posted by: Tradingshot Articles
- Category: Uncategorized
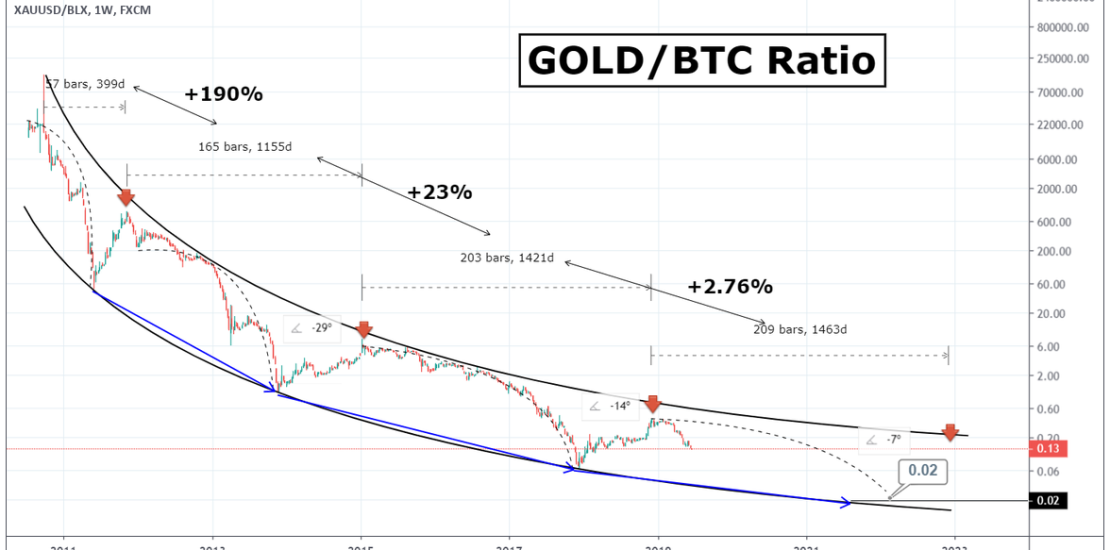
With both Bitcoin and Gold rising aggressively over the past few weeks, I thought it would be both useful and interesting to make a quick analysis of the relationship between the physical store of value (Gold) and the digital store of value (Bitcoin). The GOLD/BITCOIN ratio started off in huge favor of Gold as Bitcoin
-
BITCOIN 10k broken! This buy wave isn’t over according to Gold!!
- June 22, 2019
- Posted by: Tradingshot Articles
- Category: Cryptocurrency
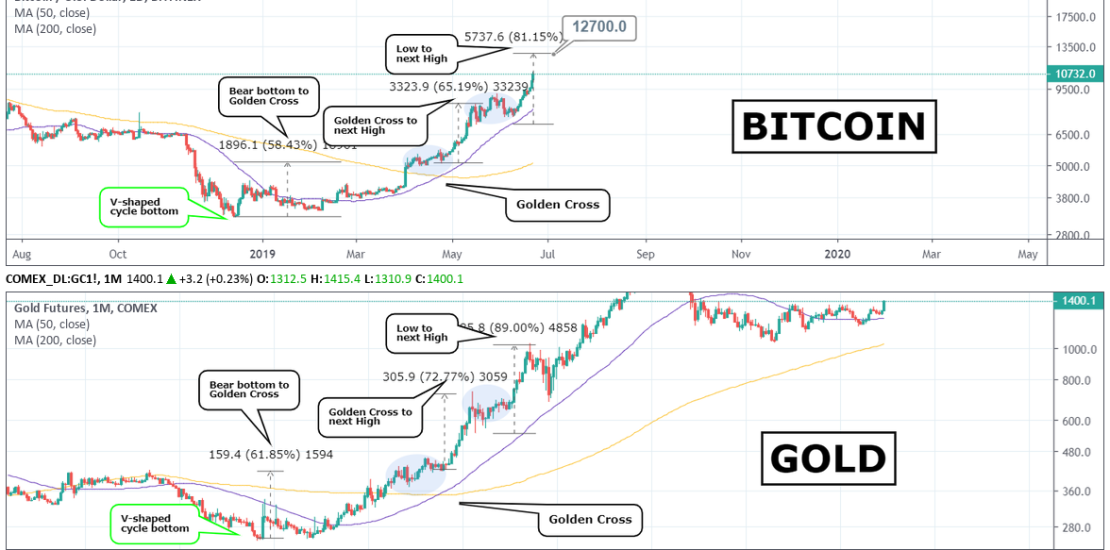
The Bitcoin – Gold road-map (the Golden standard as many call it) holds firm! Their parallel course continues but traders continue to turn their back on it. Why ignore the BTC-Gold comparison when it has been 100% accurate so far? First it predicted the market bottom and the subsequent early buy signal based on it
-
DAX Long term Buy Signal
- June 20, 2019
- Posted by: Tradingshot Articles
- Category: Uncategorized
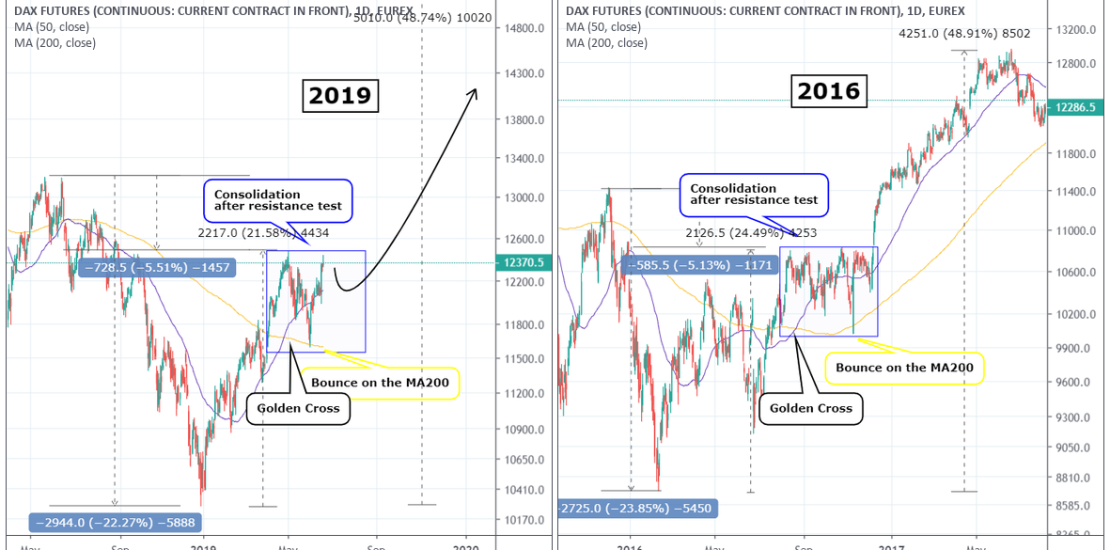
Pattern: Golden Cross on 1D. Signal: Bullish as the price action is following the 2016 pattern. Same bounce on the MA200. Target: Depends on your trading horizon. 13200 ATH with 14000 as an extension are fair targets. Tradingview link: https://www.tradingview.com/chart/FDAX1!/3bBW2mM6-DAX-Long-term-Buy-Signal
-
LINKUSD Buy Signal
- June 19, 2019
- Posted by: Tradingshot Articles
- Category: Uncategorized
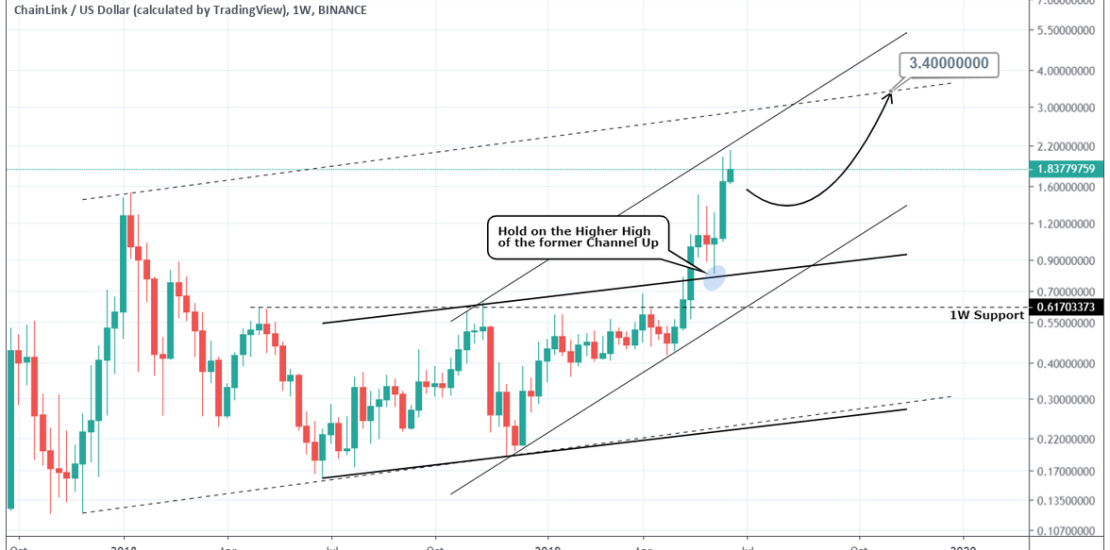
Pattern: Channel Up on 1W. Signal: Bullish as the price made a strong hold on the former Channel Up (bold lines). Target: 3.40000 (meet with the ATH trend line (dashed)). Tradingview link: https://www.tradingview.com/chart/LINKUSD/SKChReuQ-LINKUSD-Buy-Signal
-
WTI OIL Buy Signal
- June 3, 2019
- Posted by: Tradingshot Articles
- Category: Uncategorized
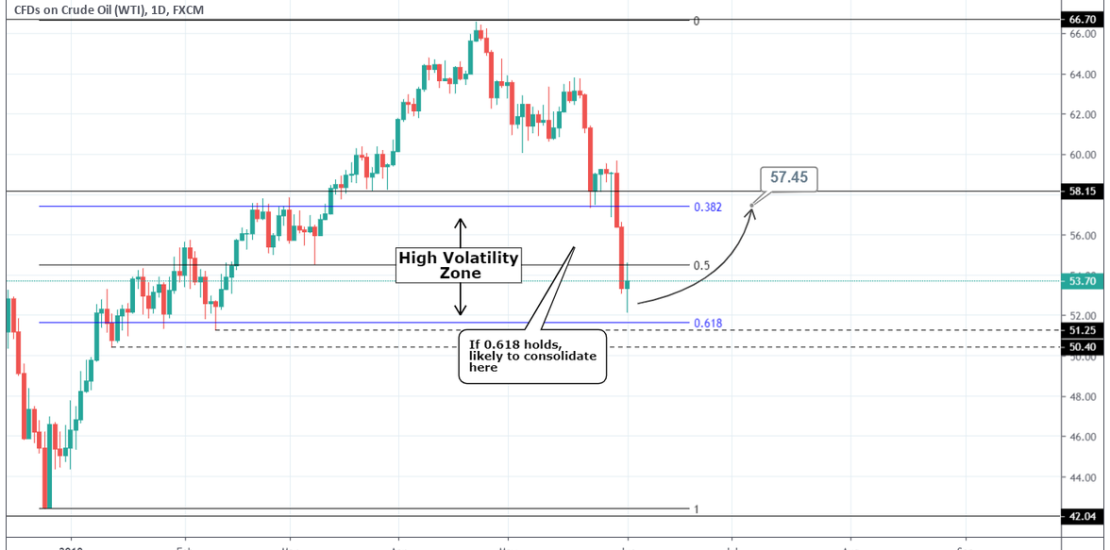
Pattern: Resistance/ Support trading based on Fibonacci levels. Signal: Bullish as the price is near the 0.618 Fibonacci retracement level and the 50.40 – 51.25 1W Support Zone. Target: 57.45 (the 0.382 Fibonacci level which may act as a Resistance). Tradingview link: https://www.tradingview.com/chart/USOIL/a4LSIRUm-WTI-OIL-Buy-Signal

