2022
-
BITCOIN The complete Cycle mapping. Will you miss out on this?
- December 28, 2022
- Posted by: Tradingshot Articles
- Category: Cryptocurrency
No Comments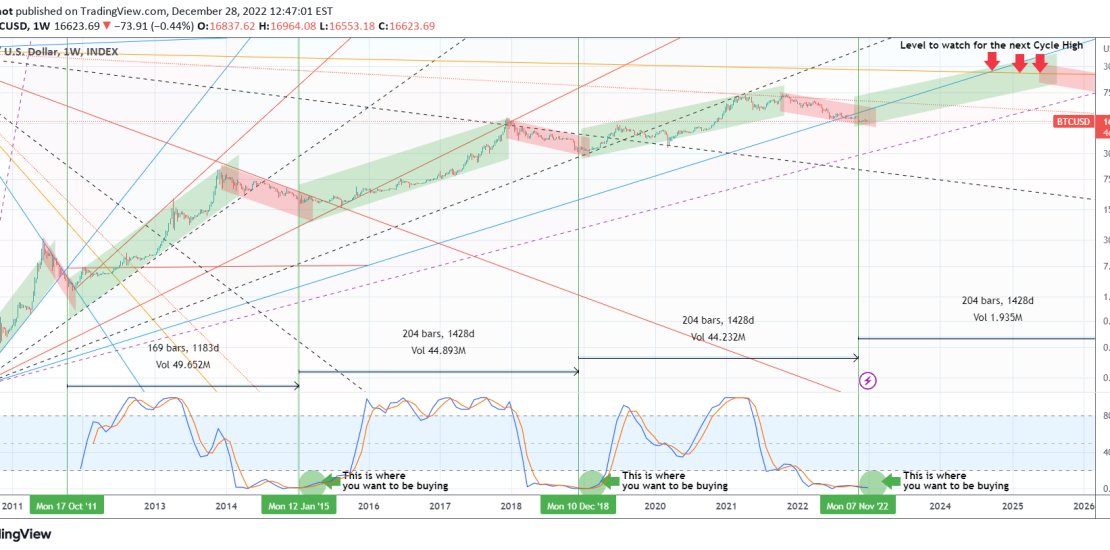
This is Bitcoin (BTCUSD) on the 1W time-frame. The current and past Cycles have been classified into Bull (green Channel) and Bear (red Channel). With an (unorthodox) use of the Pitchfan we identified the key trend-lines that have historically shaped both Bull and Bear Cycles and might continue to do so in the future. The
-
FTSE going to beat major indices and close the year in gains?
- December 28, 2022
- Posted by: Tradingshot Articles
- Category: Stock Indices
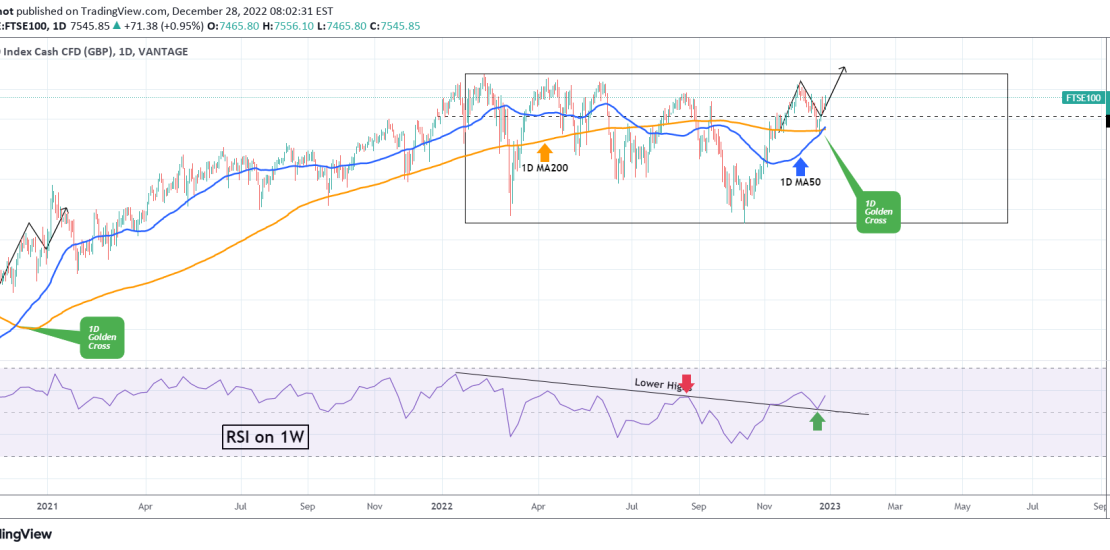
The FTSE100 index (FTSE100) has resumed its bullish trend since the October 13 bottom after hitting both the 1D MA50 (blue trend-line) and 1D MA200 (orange trend-line) on December 20. In fact, against all odds during this inflation crisis and in contrast to its heavy stock index counterparts, it is about to close the year
-
BITCOIN has always started a rally when Dow did this.
- December 27, 2022
- Posted by: Tradingshot Articles
- Category: Cryptocurrency
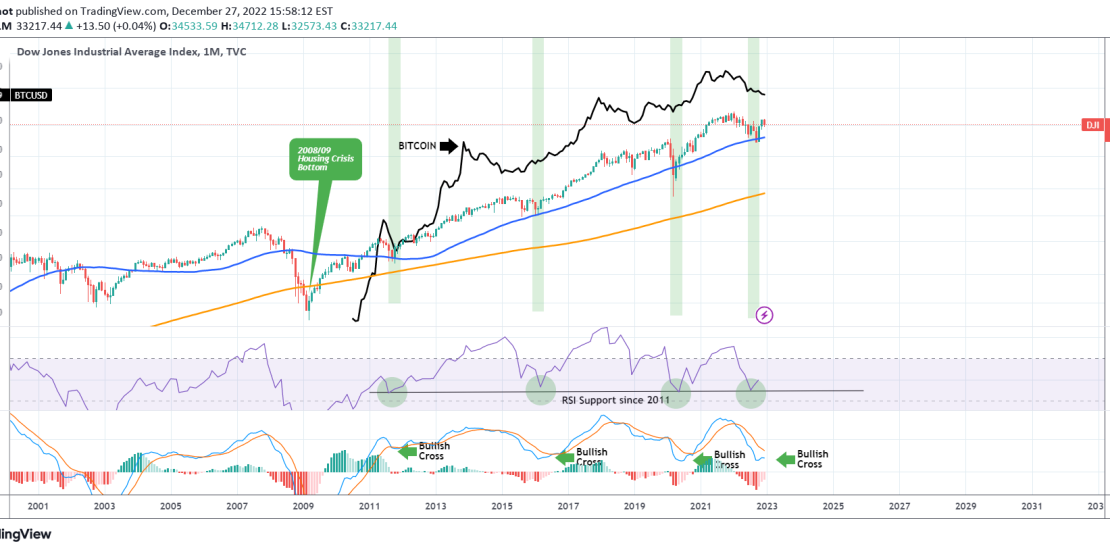
This is the Dow Jones Industrial Average Index (DJI) against Bitcoin (BTCUSD) illustrated by the black trend-line. Every since September and the touch of its 1M MA50 (blue trend-line), Dow has been rallying, having recovered more than 50% of the 2022 losses. With regards to Bitcoin, perhaps the most important development is that Dow
-
EURJPY This will determine the trend for the next 3 months
- December 23, 2022
- Posted by: Tradingshot Articles
- Category: Forex
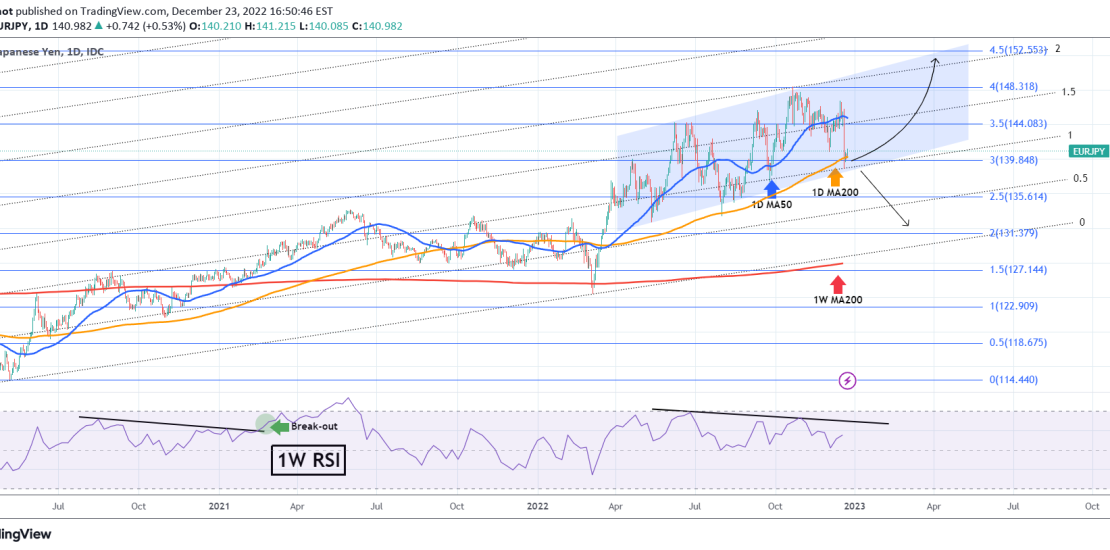
The EURJPY pair hit this week the 1D MA200 (orange trend-line) and seems to be holding it as a Higher Lows Support within the Channel Up that started in April. We first looked into this Fibonacci Channel approach in September and gave us an excellent dump and pump trade: At the moment, as
-
MATIC on a Head and Shoulders trying to avoid disaster
- December 22, 2022
- Posted by: Tradingshot Articles
- Category: Cryptocurrency
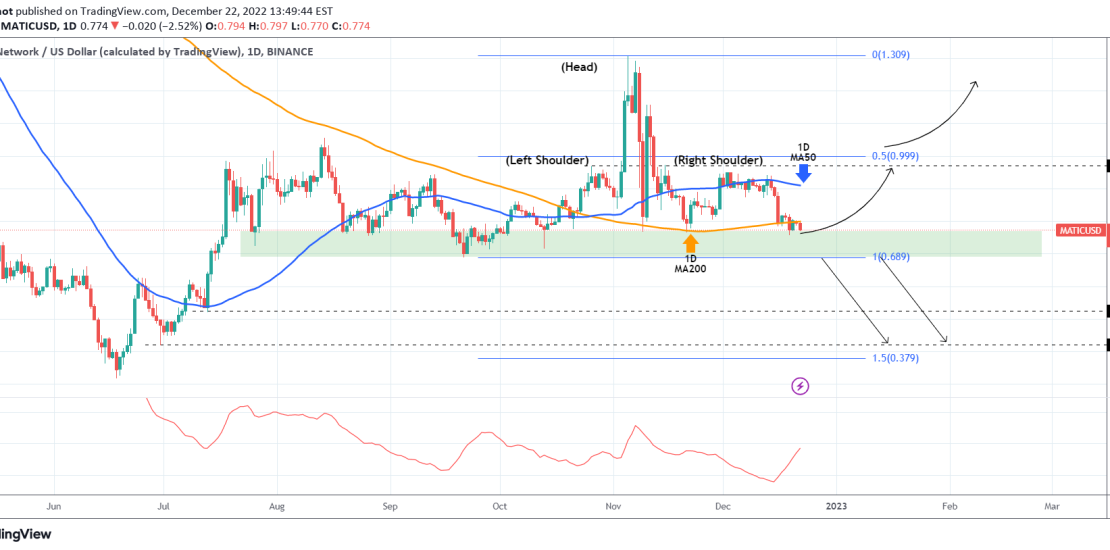
The Matic Network (MATICUSD) recently established trading below its 1D MA200 (orange trend-line), closing a daily candle below it for the first time since October 20. This alone is far from ideal for buyers but the price remains within the wide 0.690 – 0.770 Support Zone that is holding since July 26. However, we
-
EURUSD Emerging 1D Golden Cross but price can pull-back first
- December 20, 2022
- Posted by: Tradingshot Articles
- Category: Forex
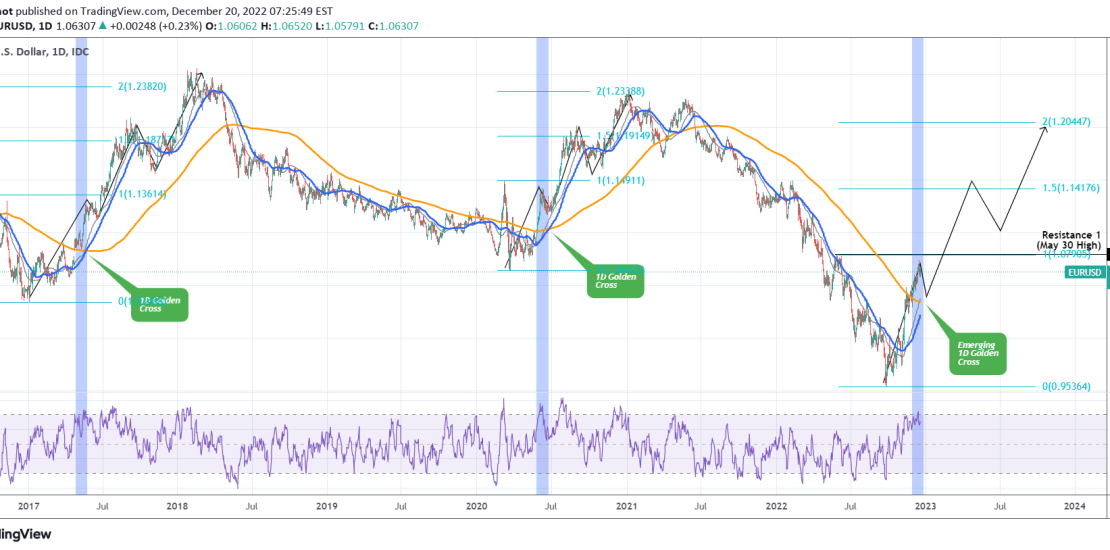
The EURUSD pair is close to forming a Golden Cross on the 1D time-frame which is the pattern where the 1D MA50 (blue trend-line) crosses above the 1D MA200 (orange trend-line). That is technically bullish but it doesn’t mean that the price can’t pull-back especially following the very aggressive rally it has been on since
-
XAUUSD Be careful with this RSI Bearish Divergence
- December 20, 2022
- Posted by: Tradingshot Articles
- Category: Commodities
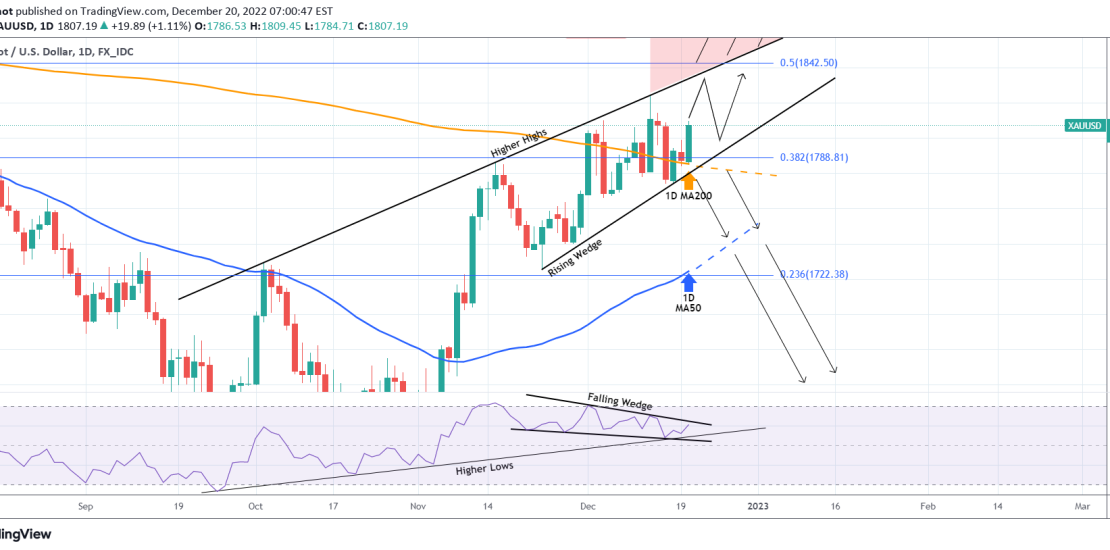
Gold (XAUUSD) is rising today supported by the 1D MA200 (orange trend-line). The pattern is so far a Rising Wedge since the November 15 High and the next Higher High limit is currently at 1835. At the same time, the 1D RSI has been within a Falling Wedge, indicating a Bearish Divergence. Though this
-
BNBUSD Why it is perhaps the best investment you can make now
- December 18, 2022
- Posted by: Tradingshot Articles
- Category: Cryptocurrency
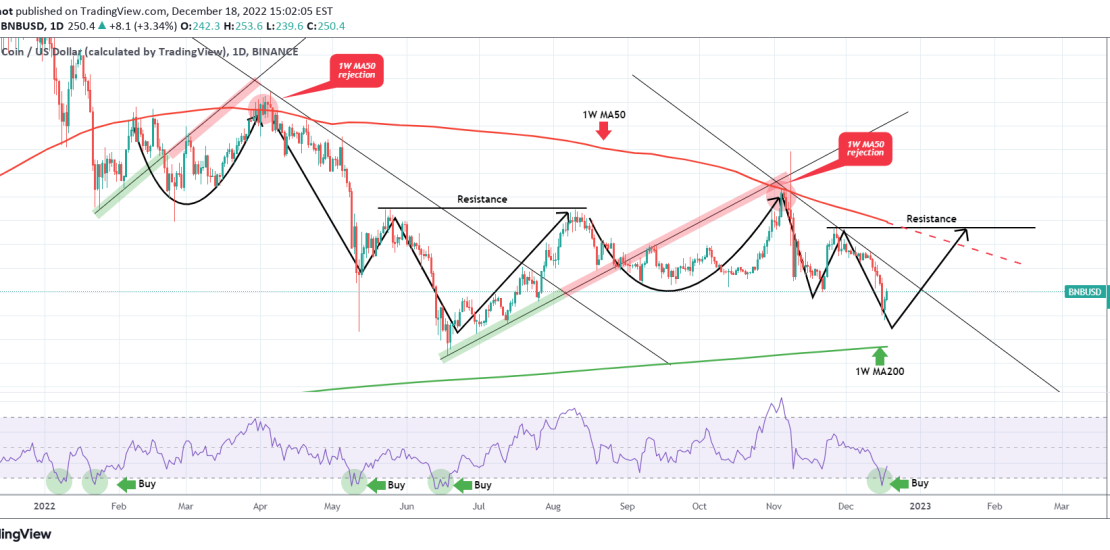
The strong pull-back on Binance Coin (BNBUSD) since the November 27 High (which was a Lower High of the Nov 08 FTX crash) seems to have come to an end as the 1D RSI breached below the 30.000 oversold barrier and is rebounding. This is identical in price action to the June low formation
-
BITCOIN 50% of stocks above 1D MA200 = Rally
- December 16, 2022
- Posted by: Tradingshot Articles
- Category: Cryptocurrency
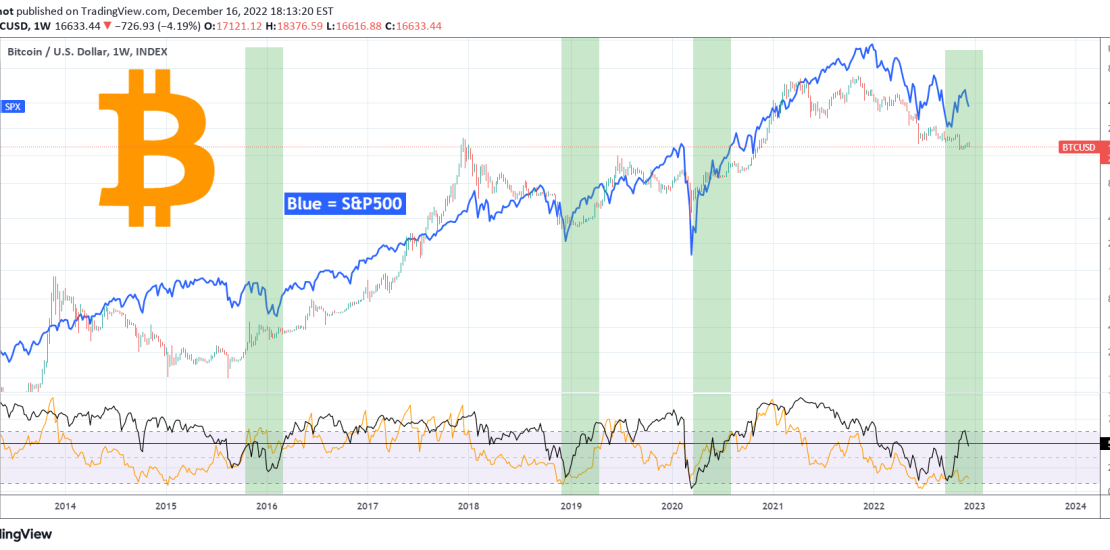
This is Bitcoin (BTCUSD) on the 1W time-frame compared to the S&P500 index (SPX) illustrated by the blue trend-line. The indicator below (black trend-line) shows that historically when 50% of the S&P500 stocks break above their 1D MA200, both Bitcoin and the S&P500 start a rally soon. Initially a few weeks of volatility takes
-
MCDONALDS Bad for your health – good for your portfolio.
- December 16, 2022
- Posted by: Tradingshot Articles
- Category: Stocks
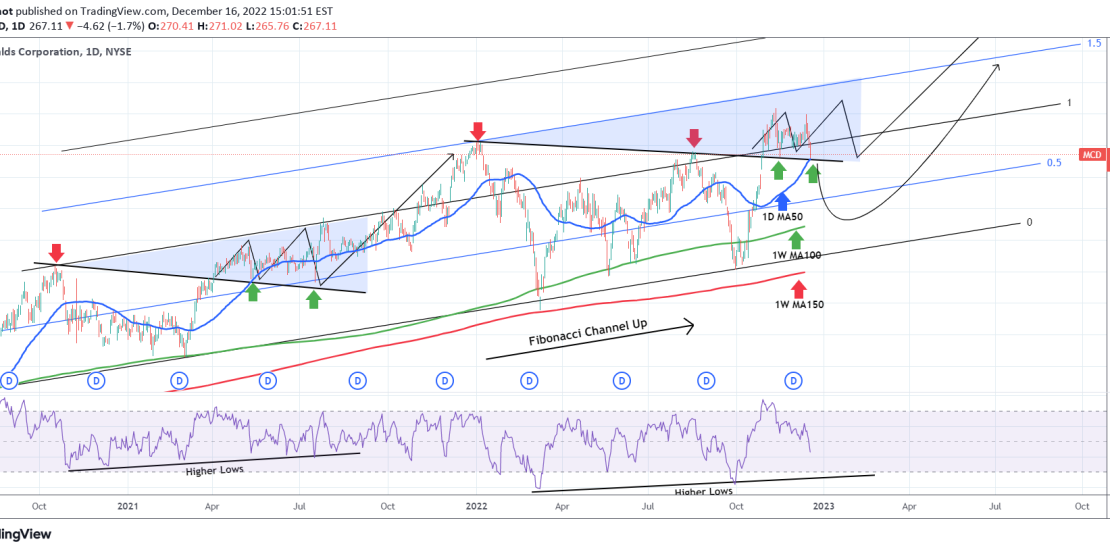
The McDonalds Corporation (MCD) is defying the Bear Market as on November 10 it made a new All Time High. Today it pulled-back to the 1D MA50 (blue trend-line) amidst the general post Fed market drop for the first time in nearly two months (since October 21). As you see it is trading within

