

- June 6, 2022
- Posted by: Tradingshot Articles
- Category: Forex
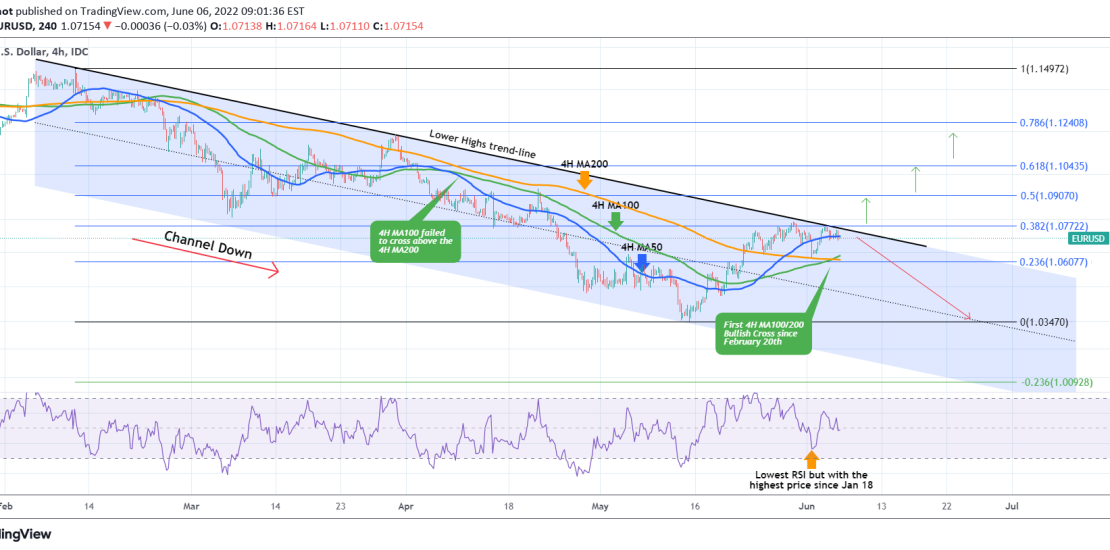
The EURUSD pair has been trading near the Lower Highs (top) trend-line of the 4 month Channel Down for the past 5 days. During this time the price tested the 4H MA200 (orange trend-line) as a Support and held. The longer it does, the stronger the buyer accumulation for breaking above the Lower Highs finally.
Notice that this is also the 0.382 Fibonacci retracement level (1.07722), which is a strong Resistance level as it is technically. A break above it, would be a bullish break-out signal that should methodically target the higher Fibs (0.5, 0.618 and 0.786). As long as the Lower Highs hold, the dominant trend remains bearish long-term, targeting the 1.03470 Low and if broken then -0.236 Fib extension. Note that by break-outs we mean 1D candle closings above or below those levels.
In addition, check the 4H RSI. When the price tested (and held) the 4H MA200 as Support, the RSI went below the 40.00 mark, the lowest level but with the highest price score since January 18, indicating that the market may finally be accumulating for a reversal of this long-term bearish trend.
Tradingview link: