

- May 17, 2023
- Posted by: Tradingshot Articles
- Category: Stock Indices
We have been so focused on the short-term Channel Up on the S&P500 (SPX) since March (see idea below) that we didn’t publish any analysis on the longer term dynamics:

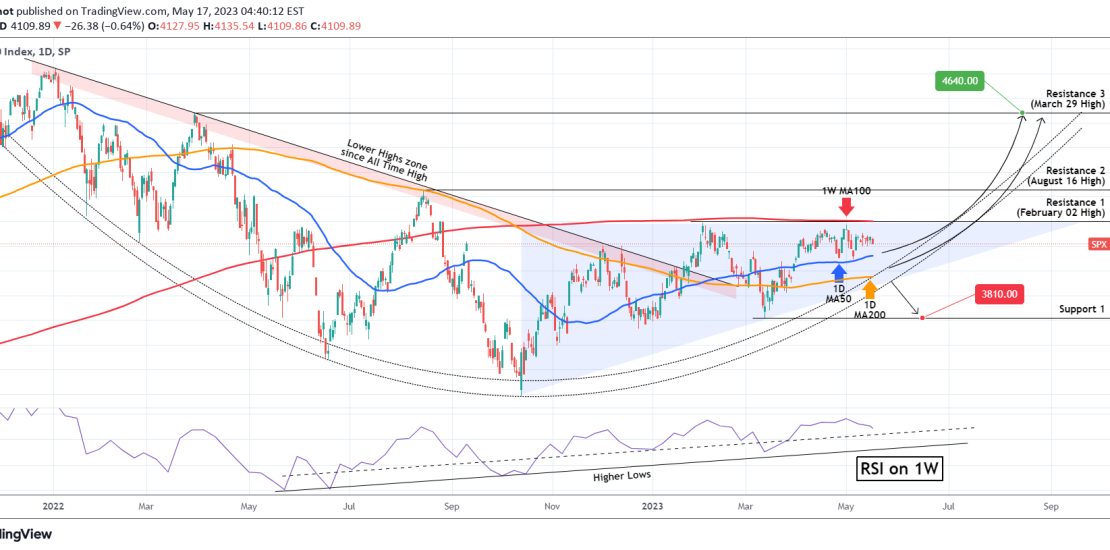
This analysis offers critical insight on where we are with regards to the long-term/ Cyclical trend. One parameter that stands out is that the S&P500 index has failed on two occasions to break the 1W MA50 (red trend-line) since August 26 2022. It just so happens now that the 1W MA100 is exactly on Resistance 1 (February 02 High). A break above it is a buy break-out signal targeting Resistance 2 (4330).
However, it is equally probable to see a medium-term pull-back since, as you see on the chart, the curved Support Zone (dotted) that is connecting all the Lower Lows since December 2021 and provided all counter-trend rallies so far goes through th 1D MA200 (orange trend-line). A bounce there (could be within 3980 – 4000), confirms the pattern and would make the Channel’s new Higher Low. If it breaks though, expect the 3810 Support 1 to be tested.
Notice also that the RSI on the 1W time-frame is approaching its own Higher Lows Zone, which has been a Buy Zone for exactly 1 year!
Tradingview link:
https://www.tradingview.com/chart/SPX/XA5tqpcQ-S-P500-The-Cup-pattern-that-nobody-notices