

2022
-
S&P500 ended the U.S elections rally. Years of volatility ahead?
- January 25, 2022
- Posted by: Tradingshot Articles
- Category: Stock Indices
No Comments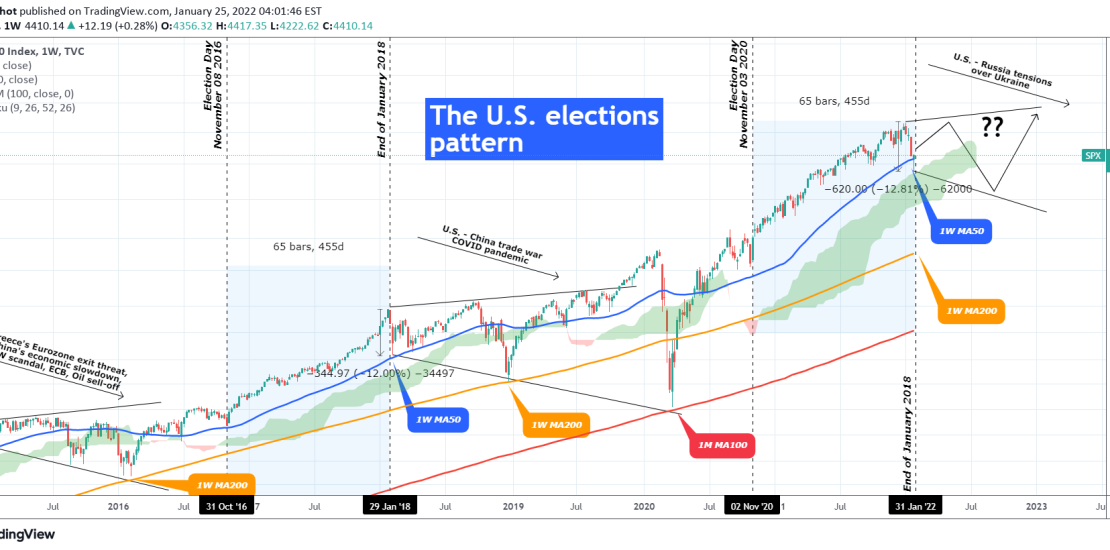
This is the S&P500 index on the 1W time-frame (on the log scale). The recent sell-off (-12% so far) is leaving many wondering what is happening and rightly so as it broke below the very strong bullish pattern (Higher Highs/ Higher Lows) since the November 2020 U.S. elections. As I looked more closely into
-
NZDUSD approaching a buy zone
- January 24, 2022
- Posted by: Tradingshot Articles
- Category: Forex
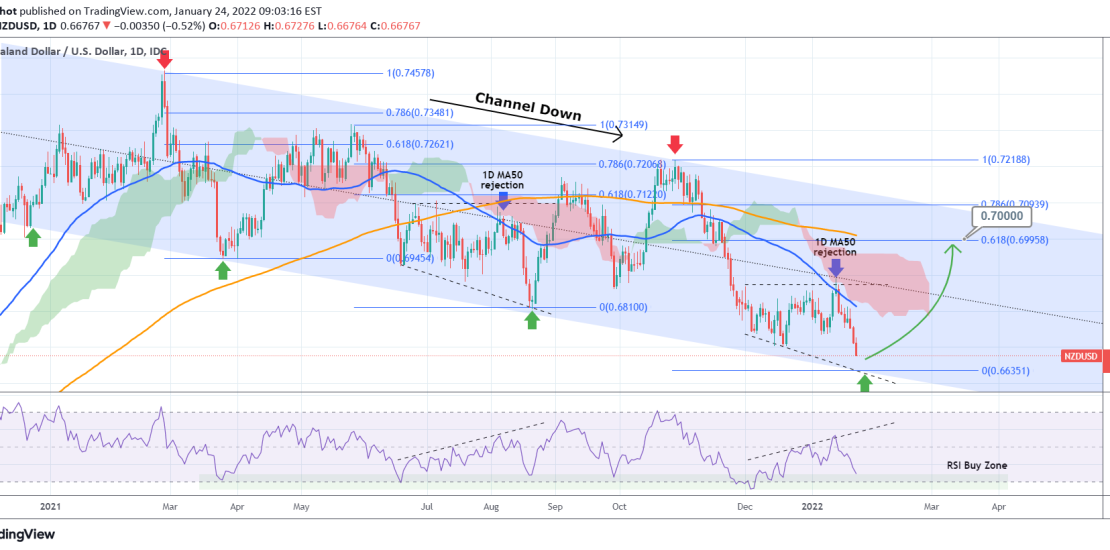
NZDUSD has been trading within a Channel Down since the start 2021. The RSI on the 1D time-frame has successfully provided very accurate buy signals within a zone that is currently very close to. The price itself is approaching the bottom (Lower Lows trend-line) of this long-term Channel Down and it resembles (also on
-
EURGBP All conditions filled for a rise
- January 24, 2022
- Posted by: Tradingshot Articles
- Category: Forex
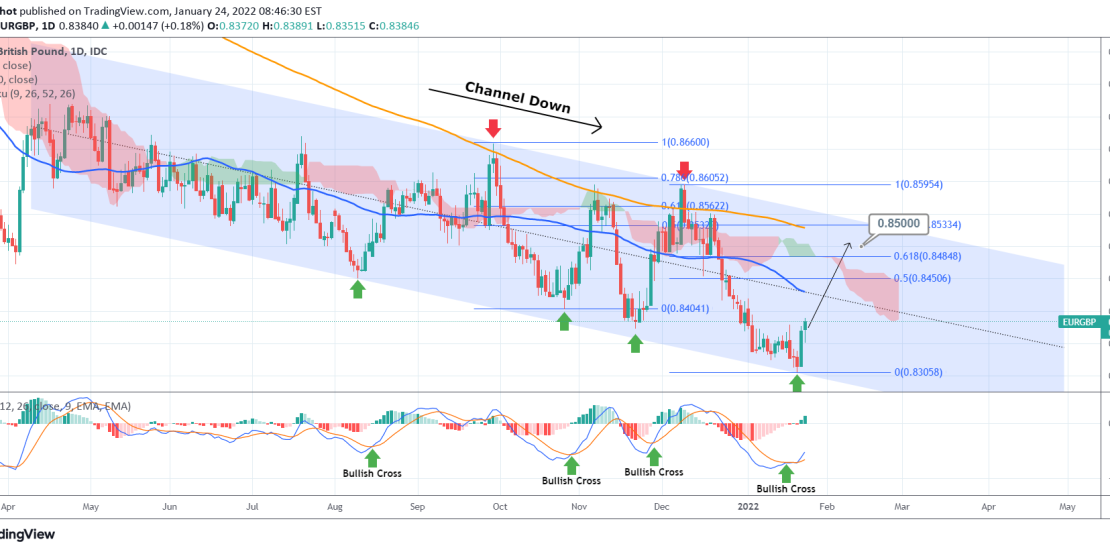
EURGBP has been trading within a Channel Down since April 2021. Last Thursday, the price touched the bottom (Lower Lows trend-line) of that Channel and Friday posted a strong green 1D candle. This also formed a Bullish Cross on the 1D MACD. Every time the price reverses near the Lower Lows trend-line of the
-
U.S. stocks crashing? If so which currencies to trade?
- January 24, 2022
- Posted by: Tradingshot Articles
- Category: Other, Stock Indices
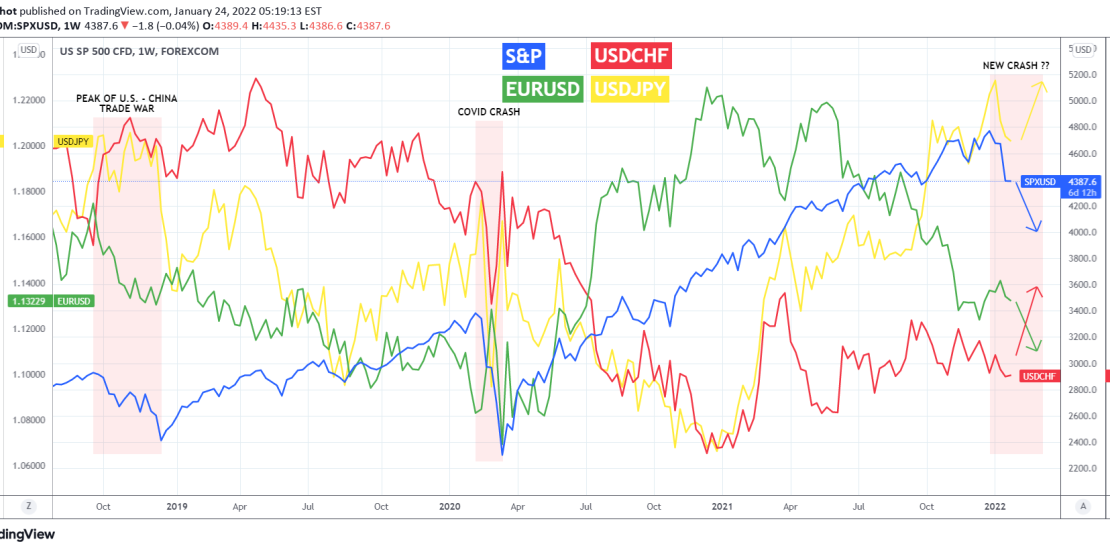
Last week was a very painful one for the U.S. (as well as global) stock markets, seeing the biggest sell-off since the March 2020 crash that was caused by the COVID outbreak panic. So if we are at the start or halfway of a typical correction on the stock markets, which currencies should we
-
XAUUSD Major long-term break-out ahead.
- January 20, 2022
- Posted by: Tradingshot Articles
- Category: Commodities
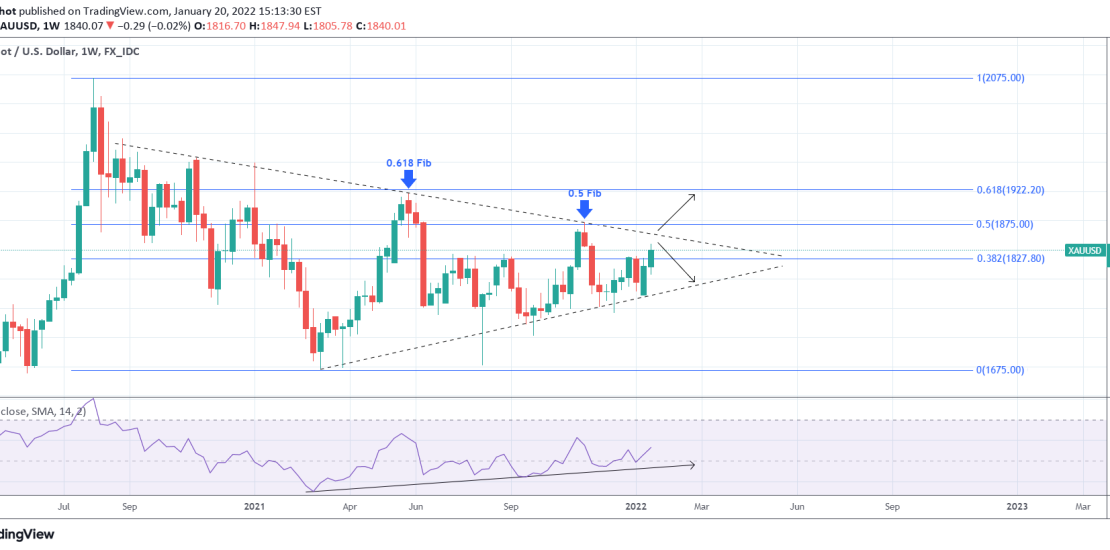
Gold eventually followed the pattern presented on my last analysis (see chart below) and after completing the Bull Flag, it reversed and broke above the 1834 Resistance: The immediate target on the short-term is 1875 (Resistance at 1877.50). However, this latest development brings us ahead of a potential huge long-term break-out. Today’s chart is
-
GOLD forming a symmetrical November bullish break-out pattern.
- January 11, 2022
- Posted by: Tradingshot Articles
- Category: Commodities
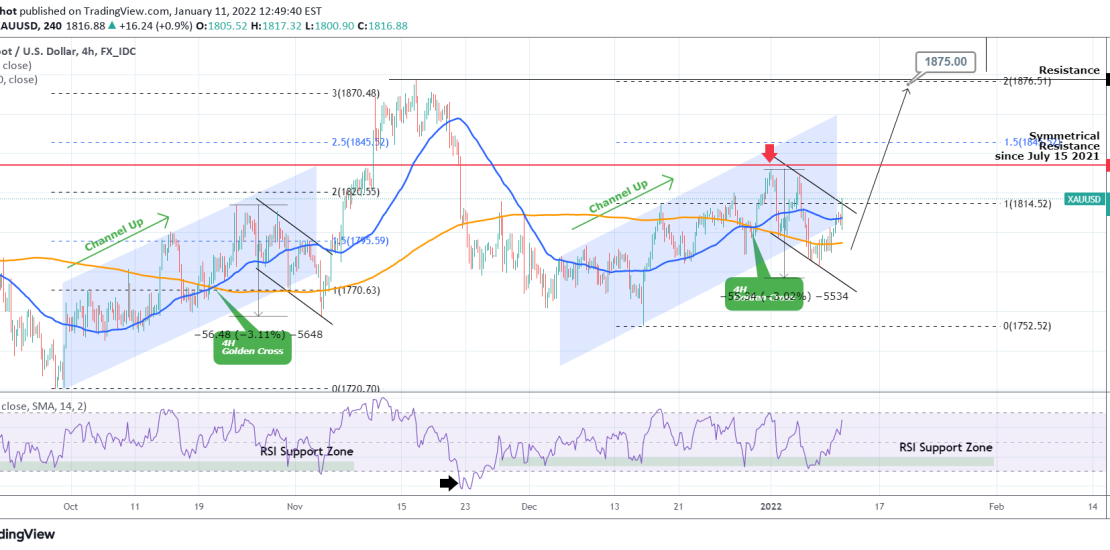
As you see Gold spot prices (XAUUSD) broke below their dominant Channel Up pattern of December but this didn’t turn out to be a bearish signal as the very same bullish (break-out) flag was formed in October’s Channel Up. The Bull Flag (black channel) eventually recovered the 4H MA50 (blue trend-line) and broke upwards,
-
WTI OIL is on track for the October $85.00 high
- January 11, 2022
- Posted by: Tradingshot Articles
- Category: Commodities
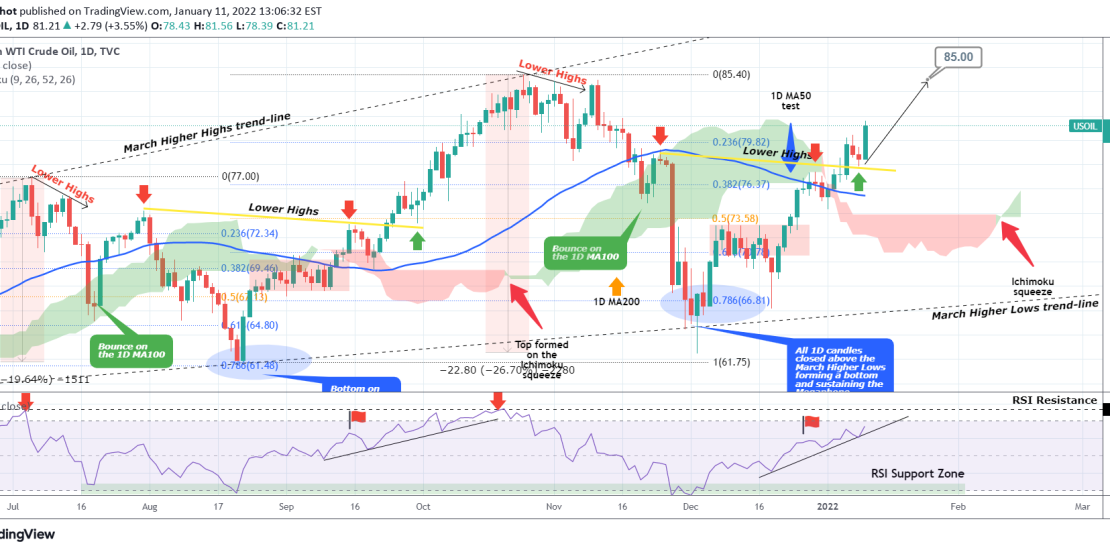
We have been following this bullish sequence on WTI Oil closely since the December 02 2021 bottom and so far is following our projection to a great extent: As you see, the most recent pull-back (red arrow) was successfully made on the yellow Lower Highs trend-line and after the price recovered, it re-tested
-
DAX waves signs of exhaustion. Top might be near.
- January 5, 2022
- Posted by: Tradingshot Articles
- Category: Stock Indices
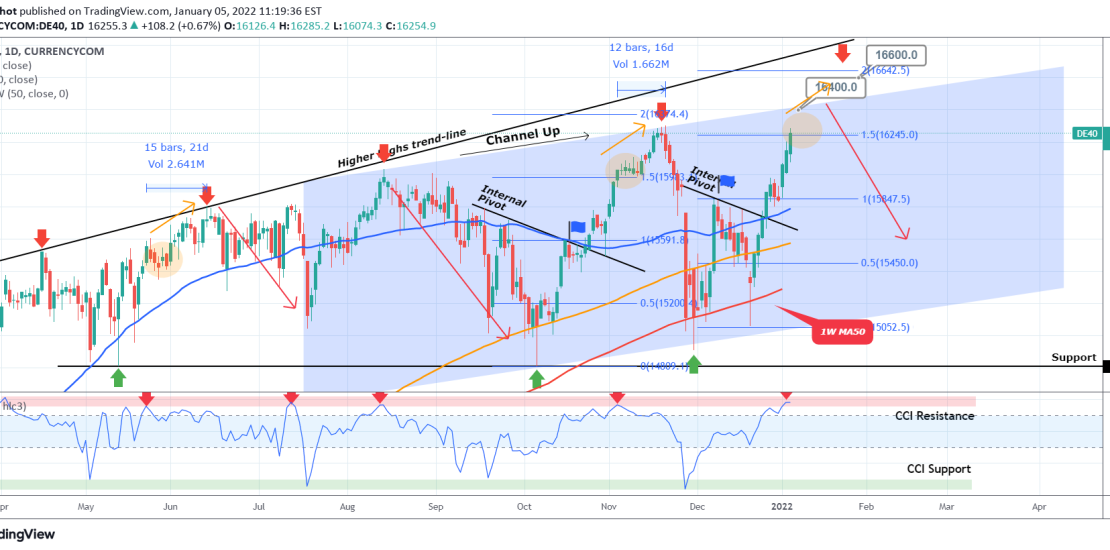
I’ve been bullish on DAX for a very long time as the Rising Wedge and Channel Up patterns prompted to Higher Highs ever since April 2021: However, the German index seems to be forming a pattern that based also on the 1D CCI, was previously seen just before market tops (i.e. Higher Highs on