

- June 6, 2022
- Posted by: Tradingshot Articles
- Category: Stock Indices
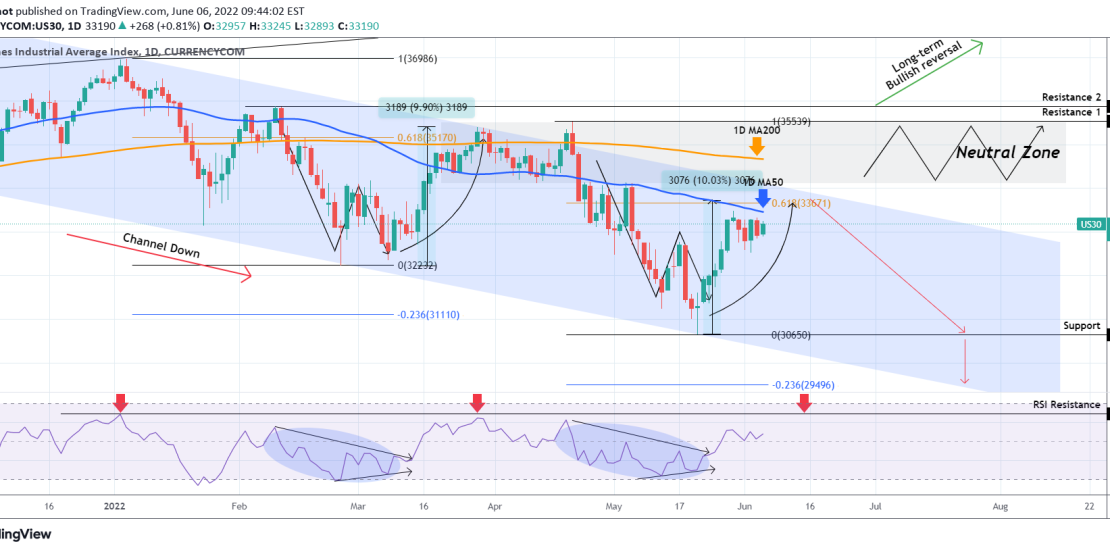
Dow Jones (DJI) eventually rebounded at the bottom (Lower Lows trend-line) of its long-term Channel Down, since our last analysis that indicated a sold R/R ratio for going long:

Since the end of May though, the index has failed just before a 1D MA50 (blue trend-line) test and turned sideways below that level. This is similar to the last Lower High formation on the Channel Down, as shown on the previous analysis.
Technically, as long as the price remains below the Lower Highs trend-line, it is a sell (on a tight SL of course) opportunity towards the 30650 Support and if that breaks, towards the -0.236 Fibonacci extension around 29500.
Even in the event of a break-out, we still can’t call a long-term bullish reversal as the range within roughly 34150 – 35540 is a Neutral Zone (we can apply tight scalping strategies there) as late March – late April showed. Only with a weekly candle close above the 35875 Resistance, we can assume that Dow has resumed its long-term bullish trend.
Tradingview link:
https://www.tradingview.com/chart/US30/YlXgg4qr-DOW-JONES-Consolidating-below-the-1D-MA50-for-a-week