

2021 January
-
WTI OIL Buy Signal
- January 27, 2021
- Posted by: Tradingshot Articles
- Category: Commodities
No Comments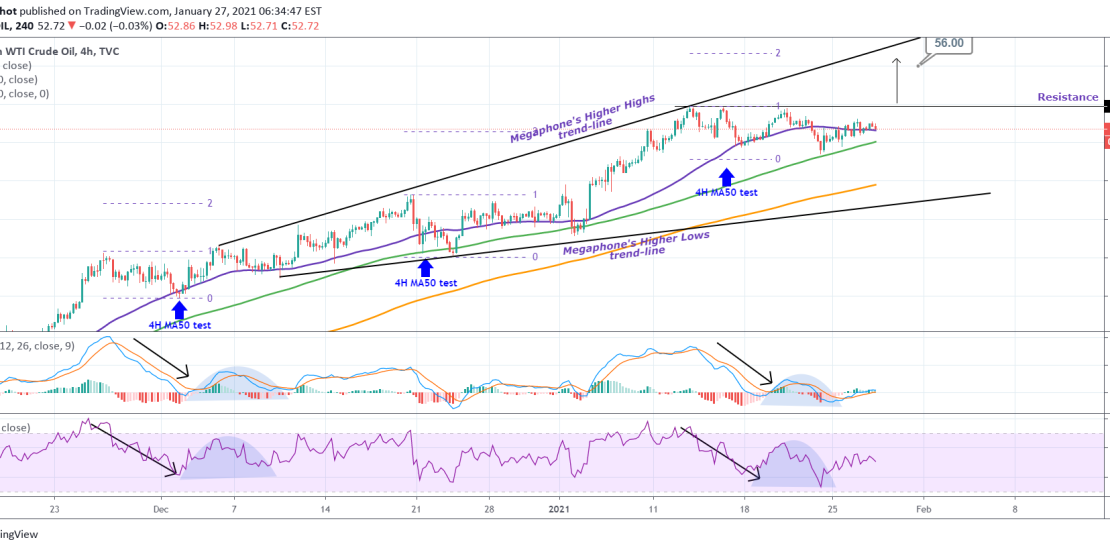
Pattern: Bullish Megaphone on 4H. Signal: Buy if the 53.90 Resistanct breaks, as the 4H MACD and RSI is repeating the December 02 – 10 bottom fractal. Target: 56.00 (the 2.0 Fibonacci extension, which has been holding since late November). ** Please support this idea with your likes and comments, it is the best
-
BITCOIN Is the 1D MA50 here to save the day?
- January 27, 2021
- Posted by: Tradingshot Articles
- Category: Cryptocurrency
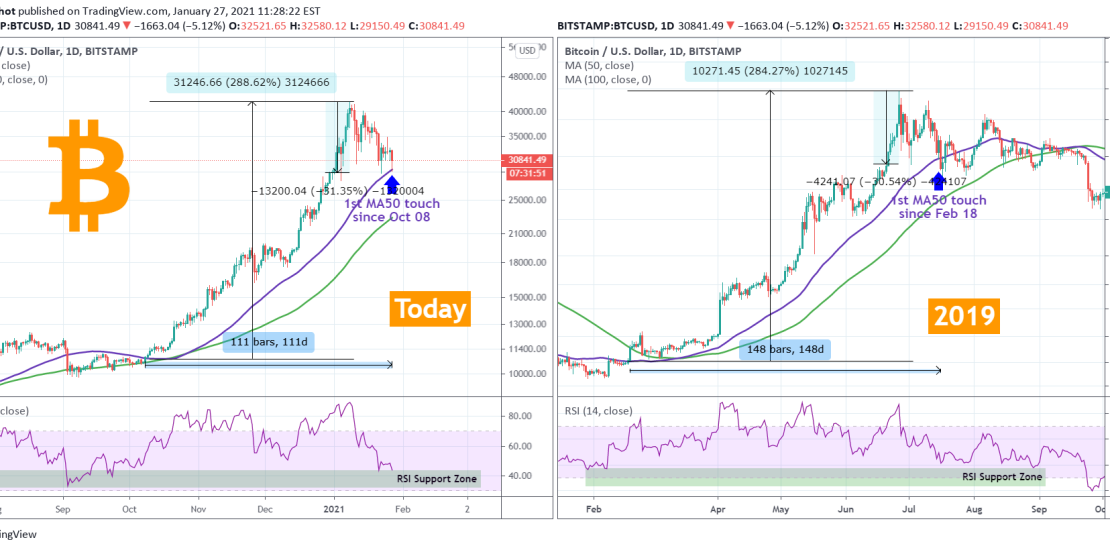
Update on today’s price action. Bitcoin made contact with its MA50 on the 1D time-frame (blue trend-line) for the first time since October 08, 2020 (roughly 110 days). The RSI is also testing its Support Zone which is holding since mid March 2020. Can this be enough to contain this correction from January’s High?
-
BITCOIN Watch out for that 4H Death Cross
- January 26, 2021
- Posted by: Tradingshot Articles
- Category: Cryptocurrency
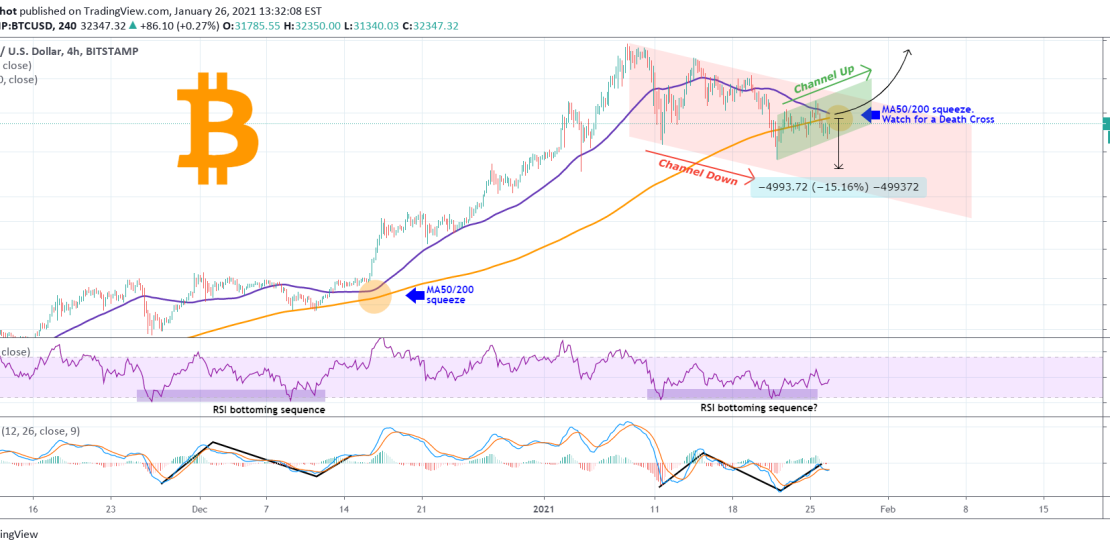
Bitcoin remains under pressure since the January 08 High, with its main pattern being a Channel Down. On the 4H chart, the RSI and LMACD indicators have formed sequences similar to the mid November – mid December 2020 consolidation phase. As you see on the chart those are bottoming patterns formed within a short-term
-
COPPER showing strength. Buy opportunity.
- January 21, 2021
- Posted by: Tradingshot Articles
- Category: Uncategorized
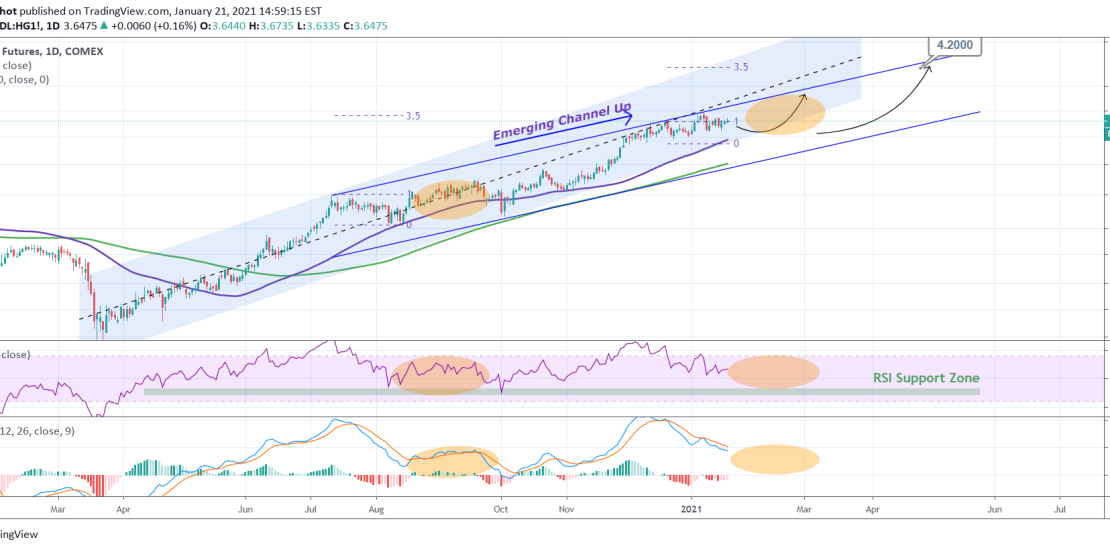
Pattern: Channel Up on 1D. Signal: Buy as the RSI and MACD are approaching their Support levels, while the 1D MA50 (blue trend-line) is closing in. Target: 4.200 (the 3.5 Fibonacci extension). ** Please support this idea with your likes and comments, it is the best way to keep it relevant and support me.
-
BITCOIN It’s the underlying trend-line… again!
- January 21, 2021
- Posted by: Tradingshot Articles
- Category: Cryptocurrency
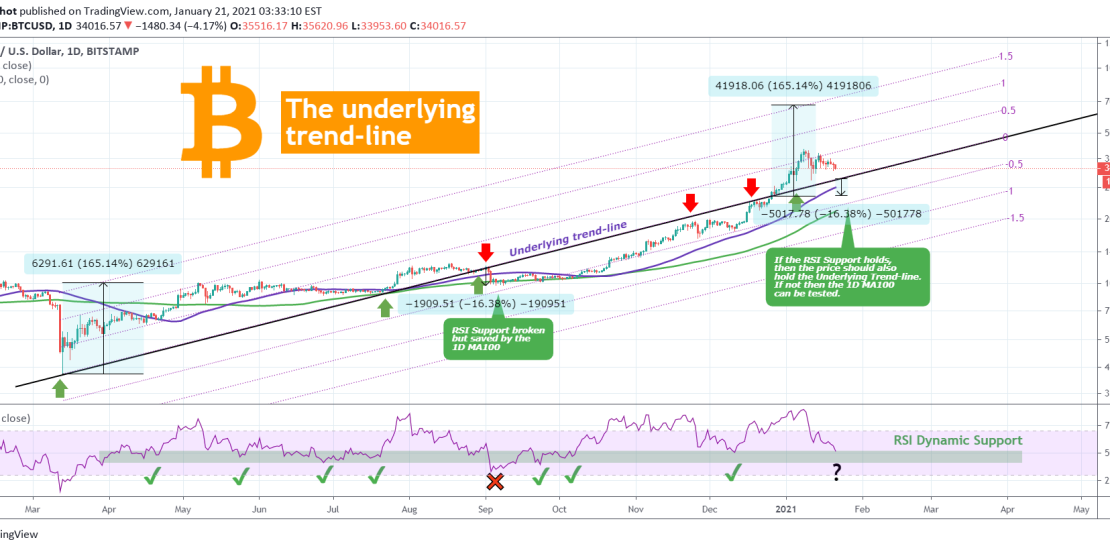
Do you remember this trend-line I posted back in June, 2020? Well it is time we have a new look at it as it is closed to being tested again. ** The underlying trend-line ** As you see this is the dominant trend-line since the March 2020 bottom that was caused by the massive
-
EURUSD Attention! Golden Cross on 1W formed!
- January 18, 2021
- Posted by: Tradingshot Articles
- Category: Forex
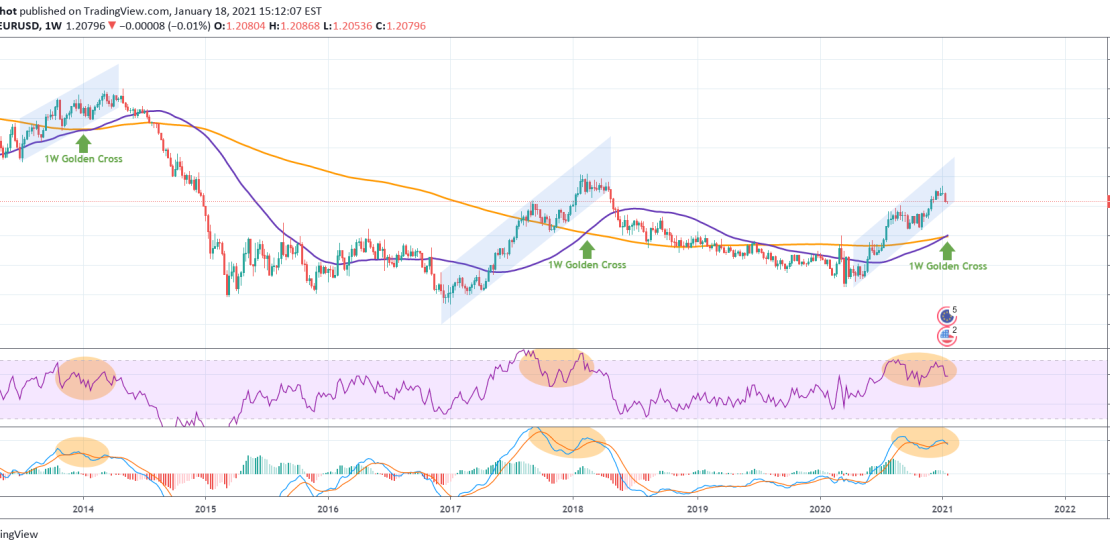
I want to post a quick notice on EURUSD where it just formed a Golden Cross (MA50 crossing above the MA200) on the 1W time-frame. That is the first time it forms this pattern since February 2018. Even though this is in theory a Bullish Formation, for EURUSD on the 1W chart, it has
-
XAUUSD Entered the 4H Support Zone – Buy Signal
- January 15, 2021
- Posted by: Tradingshot Articles
- Category: Commodities
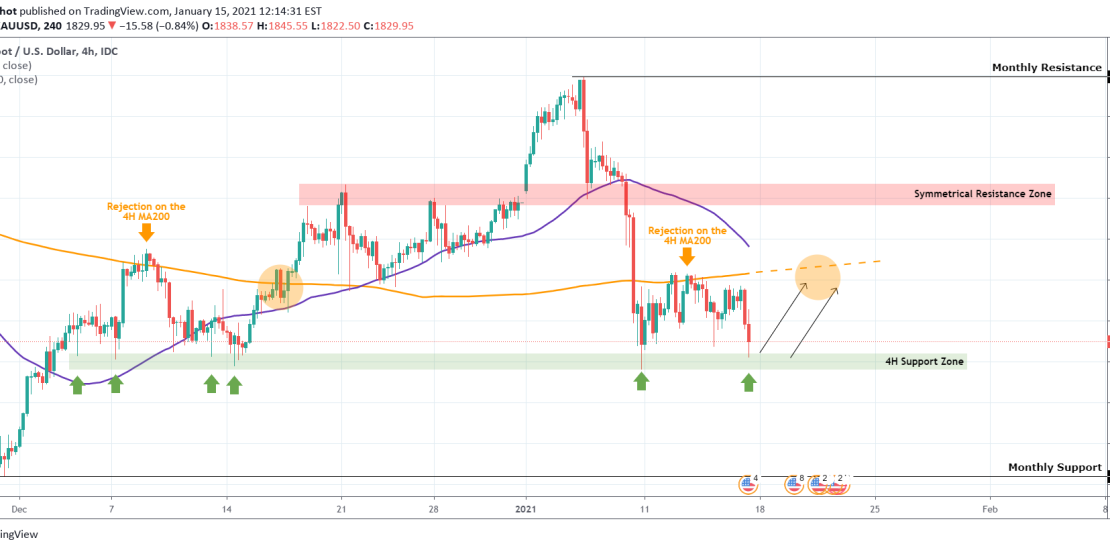
Pattern: Consolidation within the 4H MA200 (orange trend-line) and the 1,815 – 1,820 Support Zone. Signal: Buy as long as the Support Zone holds. If broken keep in mind that the 1W MA50 (ultimate yearly Support) is at 1,795. Target: the 4H MA200 and if we get a daily close above it, then the
-
BITCOIN Is this fractal the way to go?
- January 14, 2021
- Posted by: Tradingshot Articles
- Category: Cryptocurrency
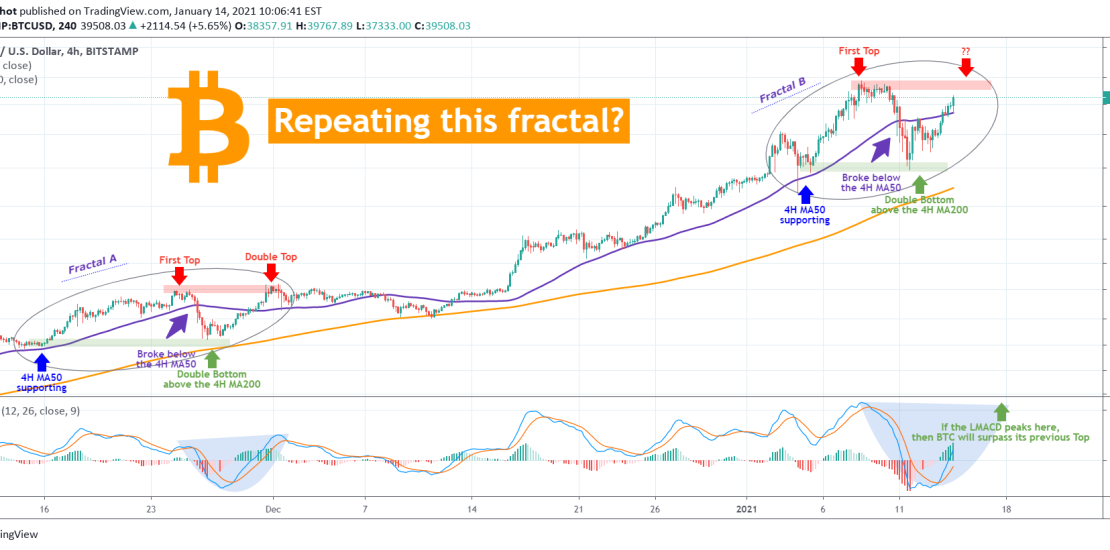
I have already mentioned the probability of Bitcoin reprinting the November fractal, but since the price convincingly broke above the 4H MA50 today and the pattern is playing out so far exactly, I thought it would be a good time for a short update. So Fractal A and Fractal B are clear on your
-
DXY conflicting patterns on the 4H and 1D time-frames.
- January 14, 2021
- Posted by: Tradingshot Articles
- Category: Forex
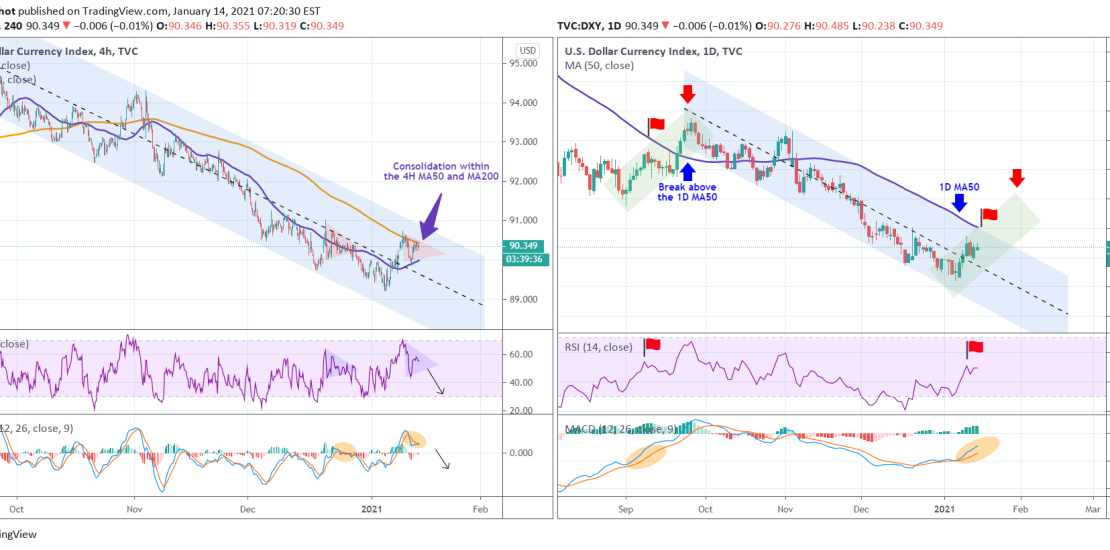
The U.S. Dollar index is consolidating for the past 2 days within the MA50 and MA200 on the 4H time-frame (chart on the left). The RSI is indicating that such consolidating, within a Triangle pattern, is similar to the December 22-25 sequence, which after it broke ended lower with a new Lower Low on
-
US10Y Bullish structure on the 10 year Bond yields
- January 14, 2021
- Posted by: Tradingshot Articles
- Category: Uncategorized
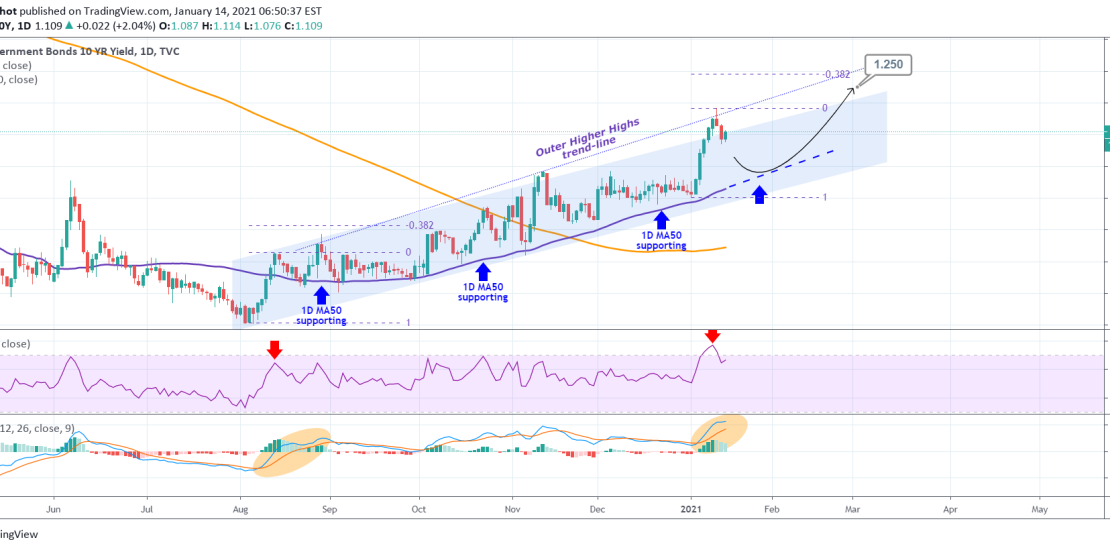
Pattern: Channel Up on 1D. Signal: Buy once the price approaches the 1D MA50 (blue trend-line) which has been the most consistent buy entry since mid August. Also based on both the 1D RSI and MACD, the August leg is currently repeated. Target: 1.250 (just under the Outer Higher Highs trend-line and the 0.382 Fibonacci
- 1
- 2