2019 October
-
EURZAR Sell Signal
- October 31, 2019
- Posted by: Tradingshot Articles
- Category: Uncategorized
No Comments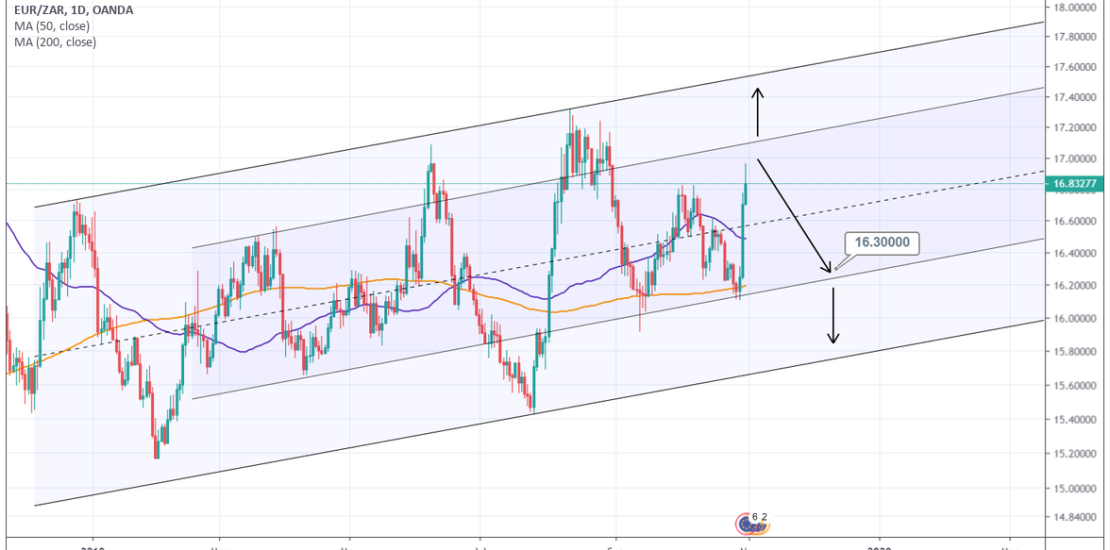
Pattern: 1M Channel Down. Signal: Bearish as the price is near the inner Higher Low trend line. Target 16.3000. Tradingview link: https://www.tradingview.com/chart/EURZAR/TrDUDUBw-EURZAR-Sell-Signal
-
NASDAQ Buy Signal to $8900
- October 30, 2019
- Posted by: Tradingshot Articles
- Category: Uncategorized
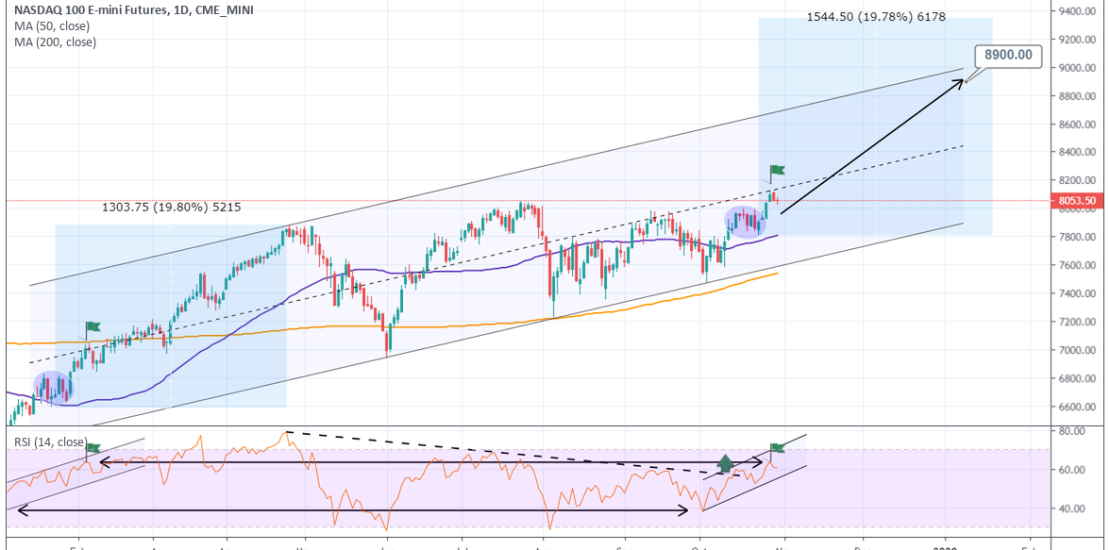
Pattern: Channel Up on 1M. Signal: Bullish as the RSI on 1D made a bullish break out above the Lower High trend line (dashed) and is replicating the start of the year pattern. Target: $8900. Tradingview link: https://www.tradingview.com/chart/NQ1!/YDWMtHs0-NASDAQ-Buy-Signal-to-8900
-
S&P500 Bullish break out
- October 30, 2019
- Posted by: Tradingshot Articles
- Category: Uncategorized
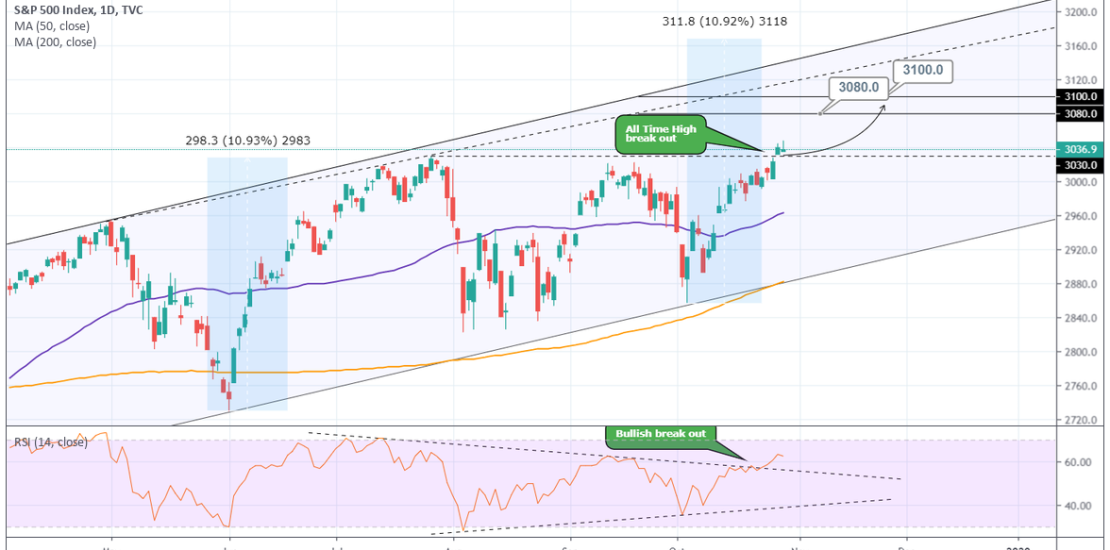
Pattern: 1W Channel Up. Signal: Bullish as the 3030 All Time High broke on a 1D bullish break out. Target: 3080 and 3100 in extension. Tradingview link: https://www.tradingview.com/chart/SPX/D2aFMBYS-S-P500-Bullish-break-out
-
We’ve seen this candle before. Will BITCOIN repeat the pattern?
- October 27, 2019
- Posted by: Tradingshot Articles
- Category: Cryptocurrency
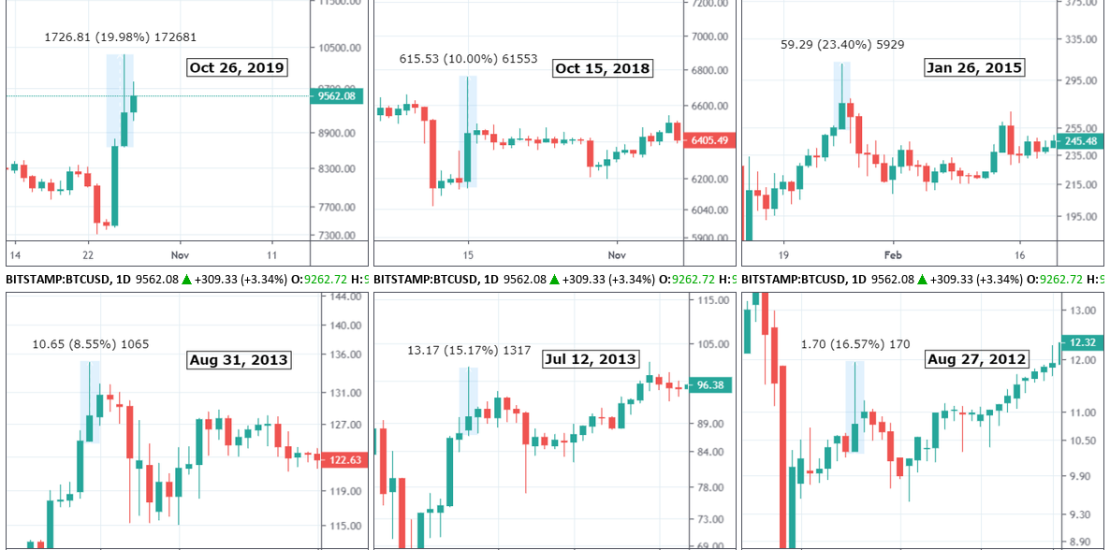
The past three days have been more than crazy with Bitcoin soaring 40% following the comments of China’s President Xi. Saturday’s 26th candle printed a rare formation with more than 50% retrace on closing from the daily high. I thought it would be useful to see how this rare candle pattern traded in the past.
-
BITCOIN Comparing past Death Crosses. Can this reveal a Top?
- October 25, 2019
- Posted by: Tradingshot Articles
- Category: Cryptocurrency
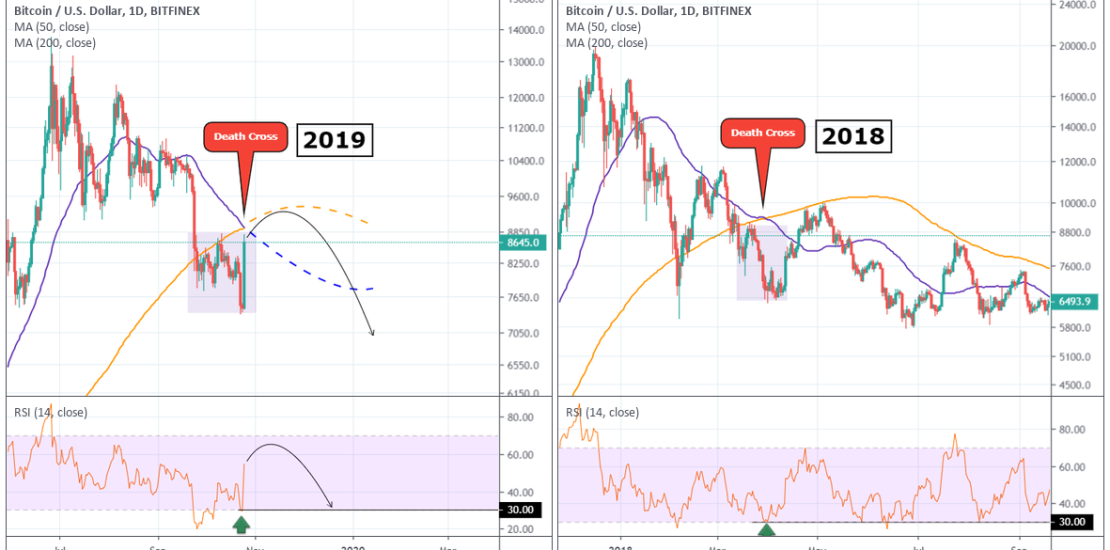
A lot of talk is being made recently regarding the Death Cross of Bitcoin on the 1D chart. Today’s extreme spike appears to be ignoring this usually bearish formation and I thought it would be productive to see how the 1D Death Cross pattern has traded in the past, both in Bull and Bear Cycles.
-
USDILS Sell Signal
- October 22, 2019
- Posted by: Tradingshot Articles
- Category: Uncategorized
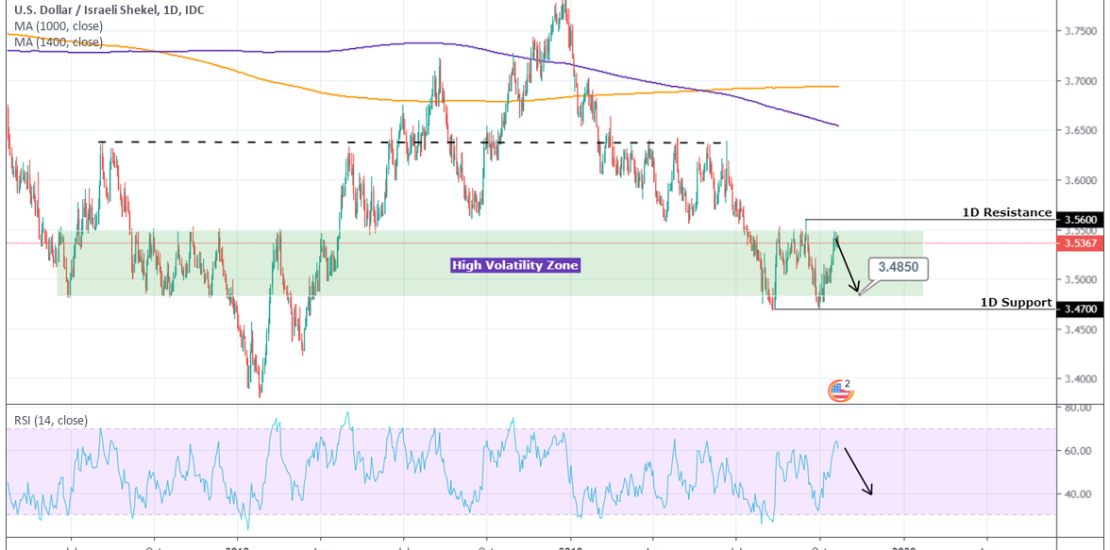
Pattern: Rectangle on 1D (3.4700 – 3.5600). Signal: Bearish as the price is at the top of the High Volatility zone and the RSI has peaked. Target: 3.4850 (bottom of the High Volatility zone). Tradingview link: https://www.tradingview.com/chart/USDILS/7WYmncyL-USDILS-Sell-Signal
-
USDCAD Buy Signal
- October 22, 2019
- Posted by: Tradingshot Articles
- Category: Uncategorized
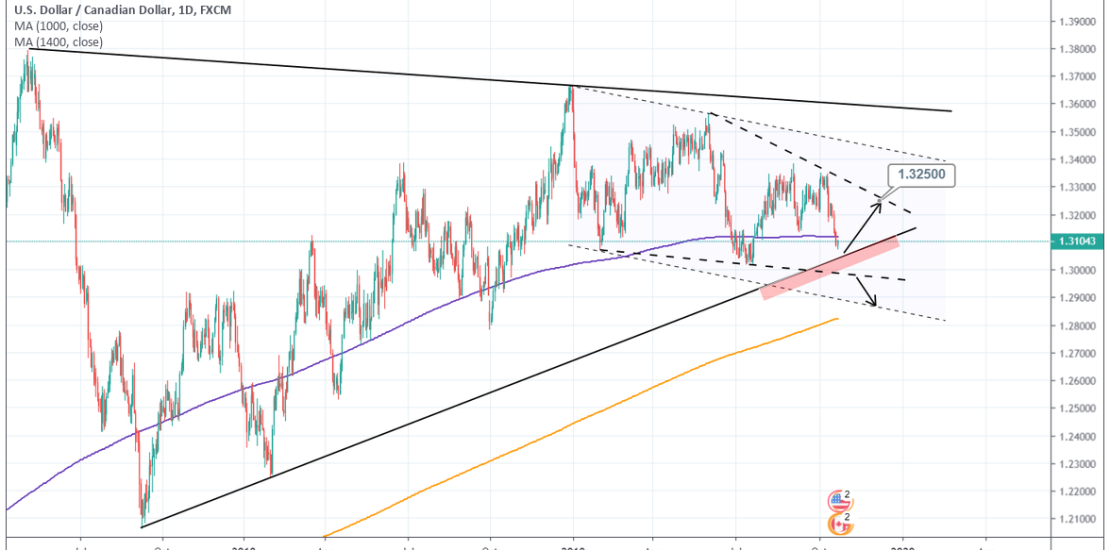
Pattern: Triangle on 1M. Signal: Bullish if the price rebounds above the Higher Low zone (red rectangle). Target: 1.32500 (Lower High suggested by the dashed Falling Wedge). Tradingview link: https://www.tradingview.com/chart/USDCAD/lyaSG3AS-USDCAD-Buy-Signal
-
BITCOIN Bottom in December? See this scary coincidence!
- October 21, 2019
- Posted by: Tradingshot Articles
- Category: Cryptocurrency
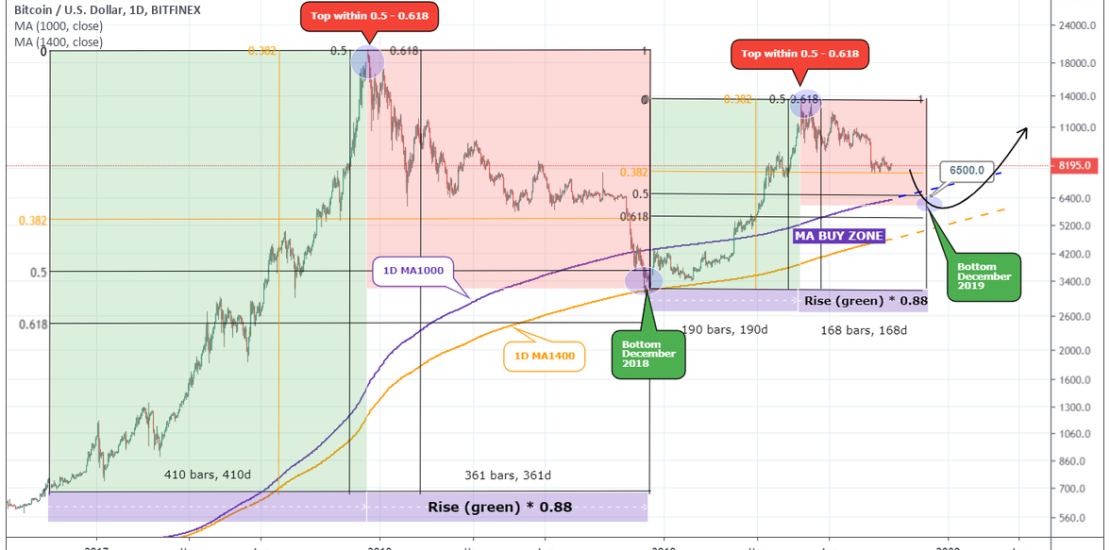
Following the latest analysis on Bitcoin’s Symmetrical Cycles (2017/18 vs 2019) on the 1M chart (you can find it at the bottom of this study), I have decided to take the research one step further and attempt to time the bottom of the current correction. In doing so I have scaled down to the 1D
-
NZDCHF Buy Signal
- October 21, 2019
- Posted by: Tradingshot Articles
- Category: Uncategorized
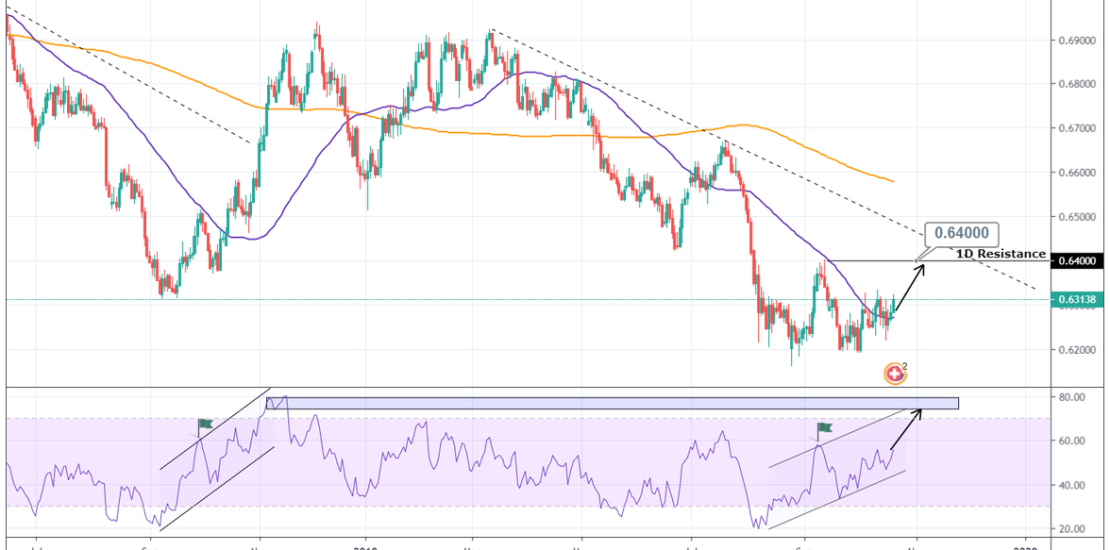
Pattern: Channel Up on 1D. Signal: Bullish due to an identical RSI occurrence. Target: 0.6400 (1D Resistance). Tradingview link: https://www.tradingview.com/chart/NZDCHF/2IreLLGx-NZDCHF-Buy-Signal
-
BITCOIN Will it make 5 straight RED MONTHS before rebounding?
- October 18, 2019
- Posted by: Tradingshot Articles
- Category: Cryptocurrency
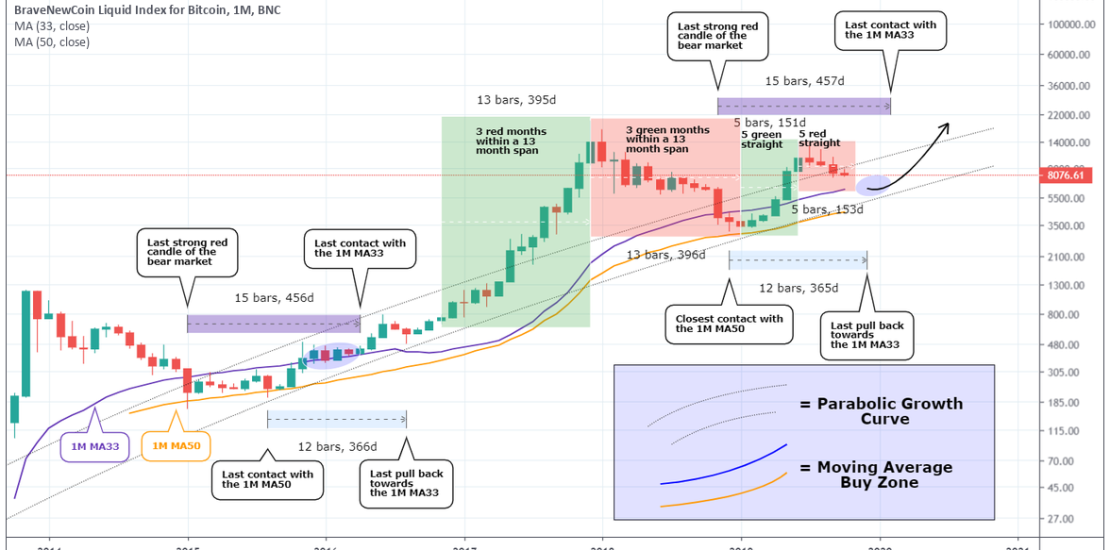
My recent long term analyses on Bitcoin were focused on the $6000 region as a potential buy and more particularly the demand zone that certain Moving Averages (among other technical indicators) provided around this region. The first studies were centered on the 1D and 1W time frames (shown just below), this time I take it

