
-
UBER is still bullish short-term
- May 3, 2023
- Posted by: Tradingshot Articles
- Category: Stocks
No Comments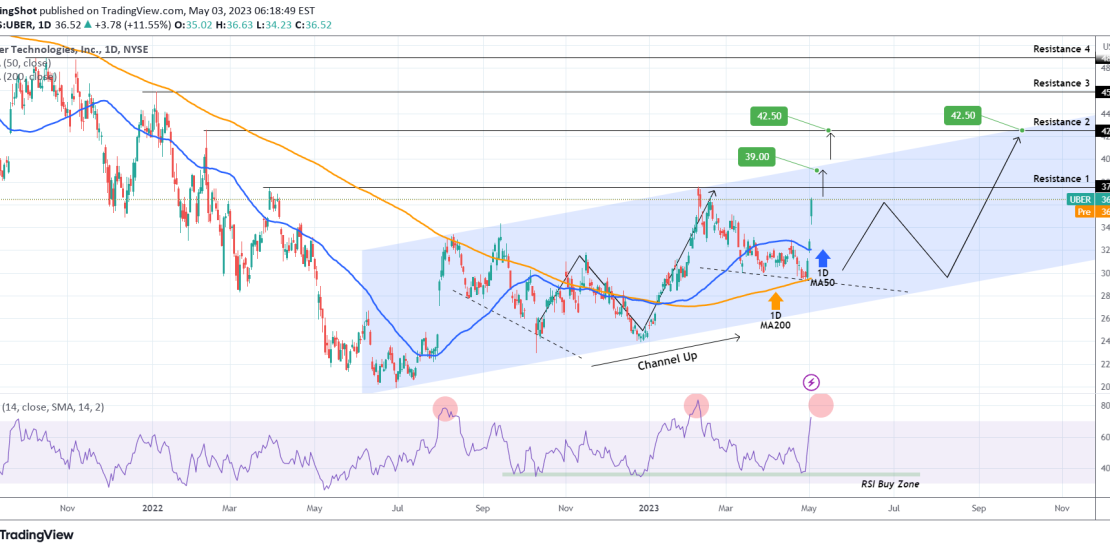
UBER had a massive price jump yesterday after the upbeat earnings and is approaching Resistance 1 (37.50), which rejected the February 08 High. That was the last Higher High of the Channel Up pattern that started after the June 30 bottom. We expect this trend to continue for a new Higher High at 39.00. If
-
COMCAST eyeing an end-of-quarter 44.00 target.
- April 28, 2023
- Posted by: Tradingshot Articles
- Category: Stocks
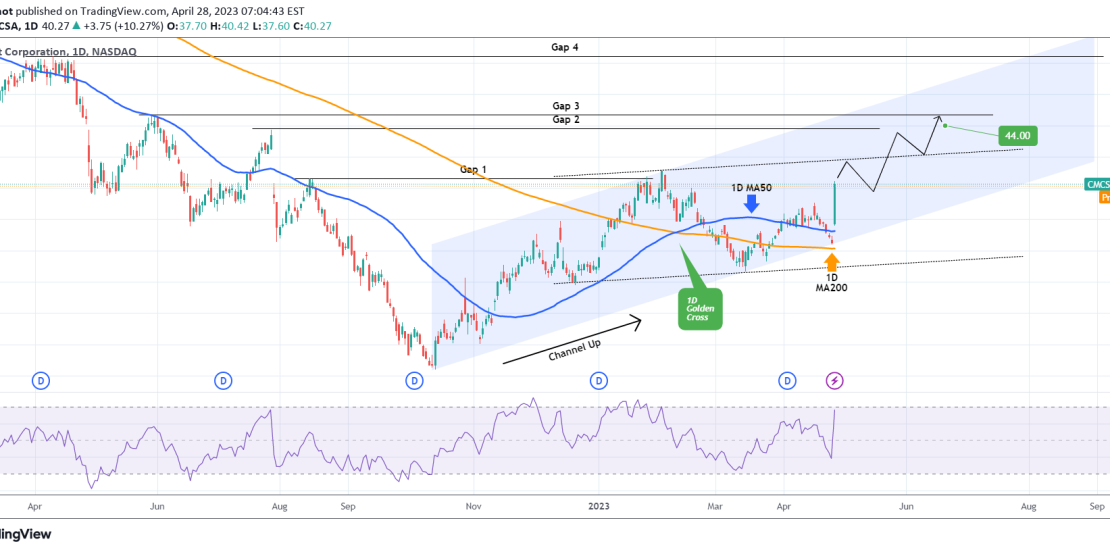
The Comcast Corporation (CMCSA) had a +10% jump yesterday, capitalizing on the higher than expected earnings and is approaching the February 02 High. The long-term pattern is a Channel Up (blue) but there might be a diverging Channel Up also emerging (dotted lines) that might decelerate this aggressive rise. So far we see a tendency
-
NETFLIX This price jump will be huge and can reach $490.
- March 23, 2023
- Posted by: Tradingshot Articles
- Category: Stocks
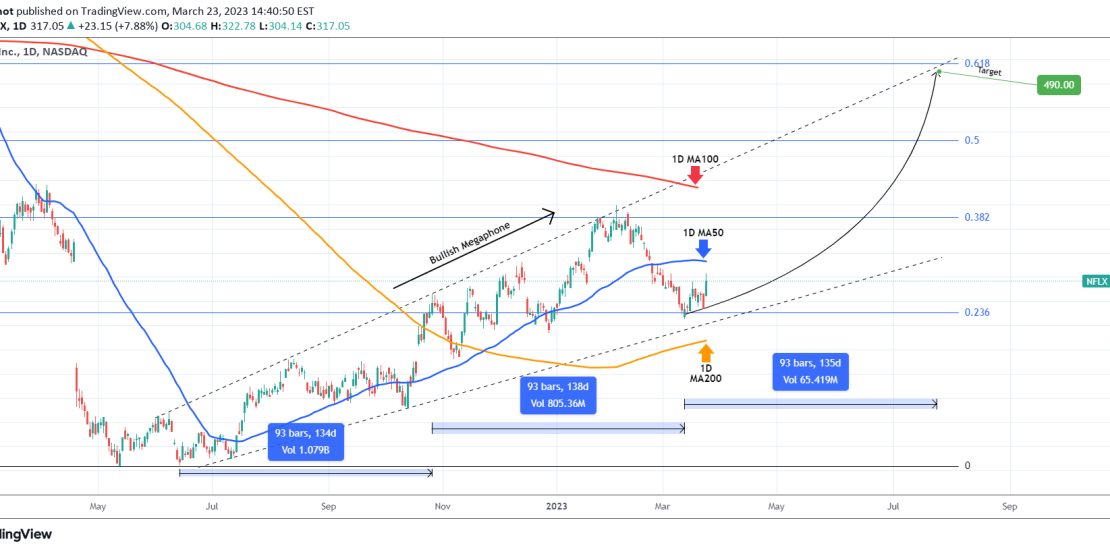
Netflix (NFLX) has gone a long way since we called the exact bottom back on our April analysis: Since then, the stock has formed a well structured Bullish Megaphone pattern, which is currently rising after almost touching its bottom. The 1D MA50 is the short-term Resistance and the 1W MA100 (red trend-line) the long-term. A
-
APPLE Inverse Head and Shoulders give a new All Time High
- March 6, 2023
- Posted by: Tradingshot Articles
- Category: Stocks
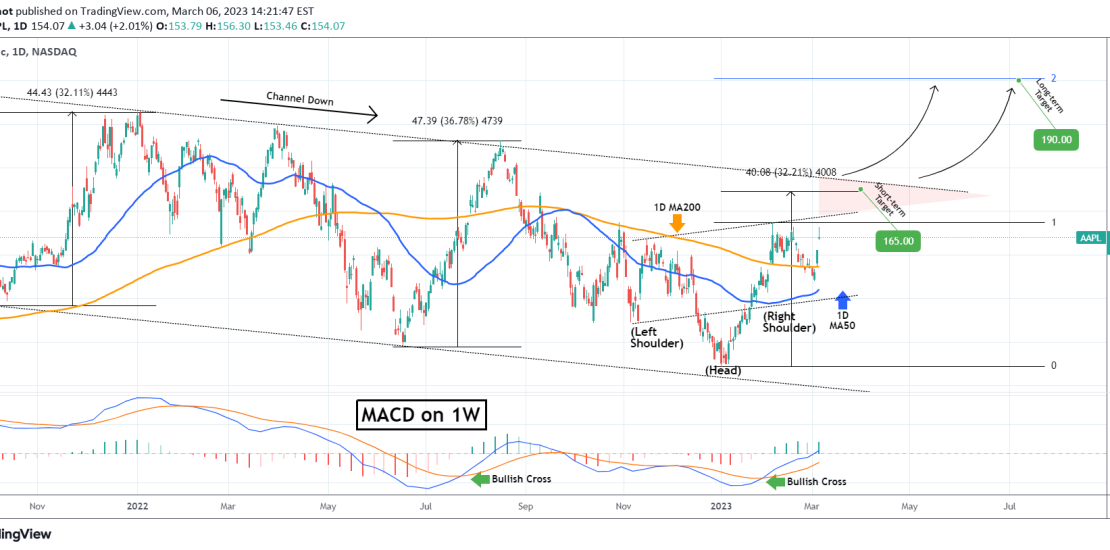
Apple Inc. (AAPL) has just completed an Inverse Head and Shoulders pattern, with its Head being the January 03 market Bottom. The Bear Cycle isn’t technically over for Apple as the Channel Down that started back on the October 04 2021 Low hasn’t yet been broken. In fact since the last two Lower Highs sequences
-
AMD Targeting $95.00
- March 1, 2023
- Posted by: Tradingshot Articles
- Category: Stocks
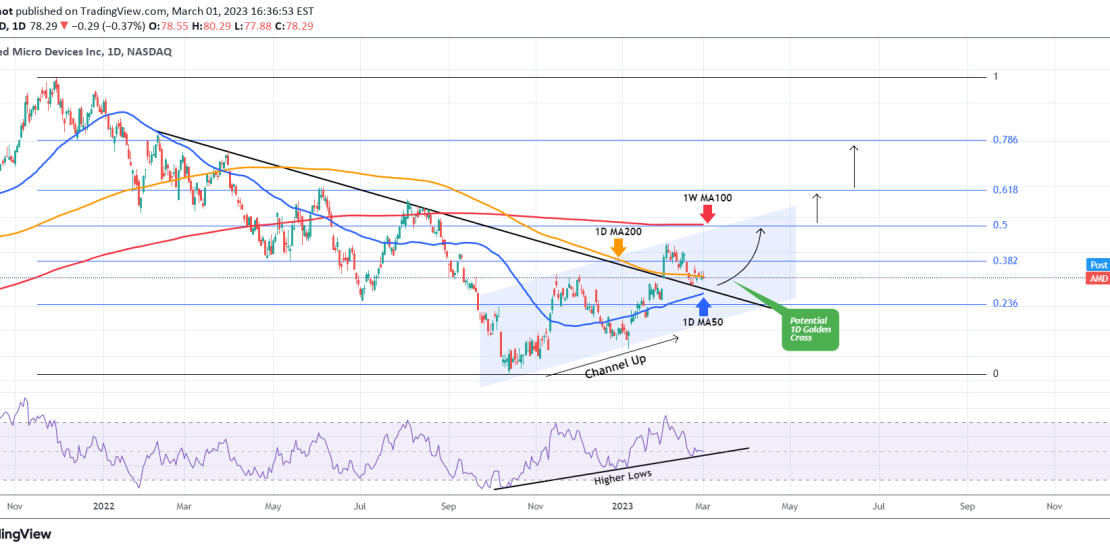
Advanced Micro Devices (AMD) are trading within a Channel Up pattern since the October 13 Low and is about to form a 1D Golden Cross. The 0.5 Fibonacci retracement level is exactly on the 1W MA100 (red trend-line) and we set a medium-term term target on it at $95.00. We expect every closing above each
-
ELI LILLY on the best buy opportunity of the year!
- March 1, 2023
- Posted by: Tradingshot Articles
- Category: Stocks
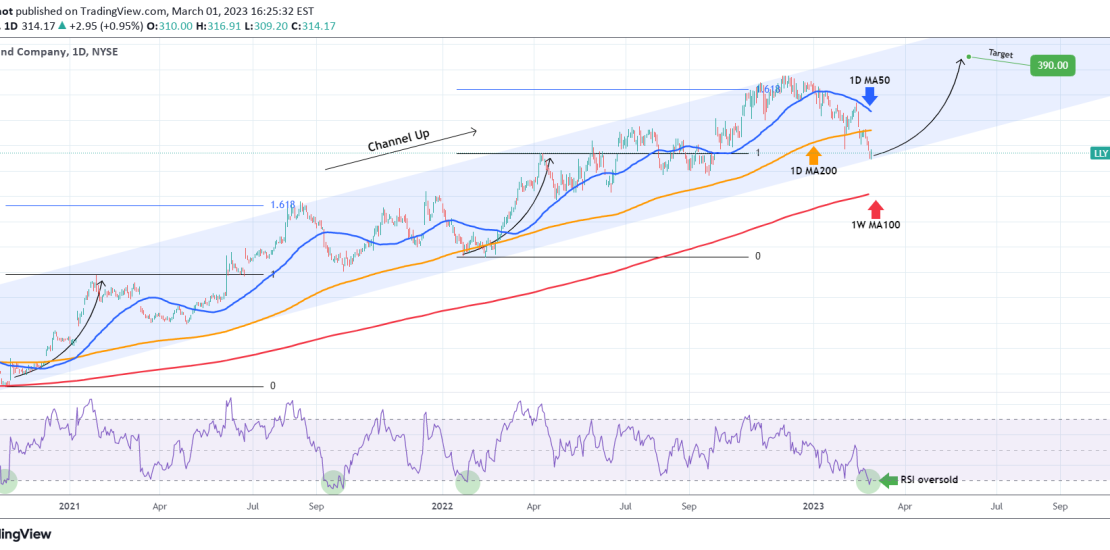
Eli Lilly and Company (LLY) has been trading within a Channel Up pattern since the October 30 2020 low exactly on the 1W MA100 (red trend-line). As the 1D RSI turned oversold below the 30.00 barrier, while the price touched the bottom (Higher Lows trend-line) of the Channel Up, it has filled all conditions for
-
META You were warned. This is a V-shaped recovery.
- February 2, 2023
- Posted by: Tradingshot Articles
- Category: Stocks
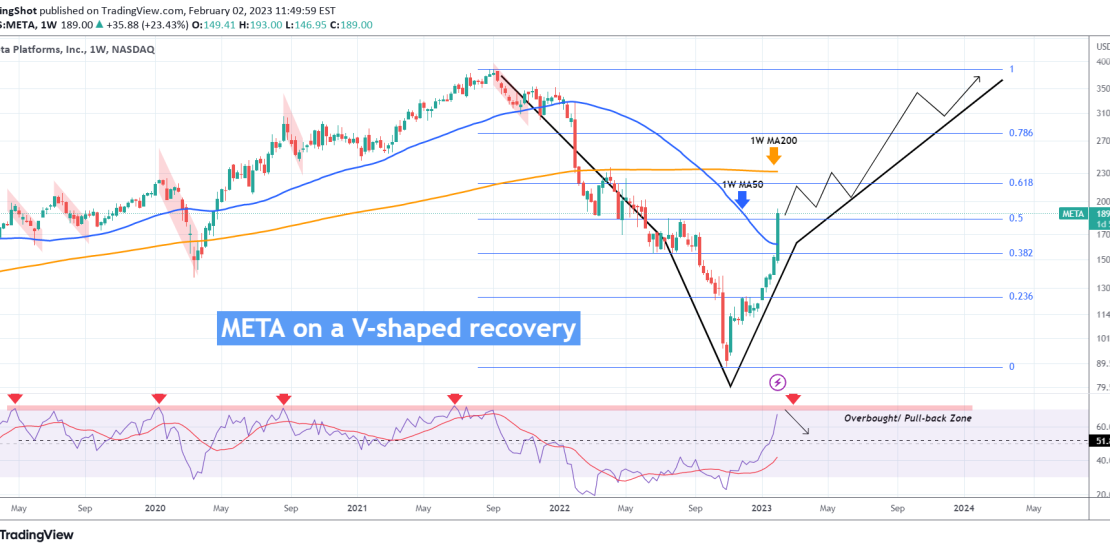
Meta Platforms (META) stock is surging through the roof following the encouraging Fed outlook on future rate hikes and Zuckerberg’s promises on stock buy-backs, cost cutting and focus on profitability. We warned META was an excellent buy last month after closing two straight green monthly candles as well as back in November when we advised
-
TESLA Above its 1D MA50, first time since September. 193 target.
- January 26, 2023
- Posted by: Tradingshot Articles
- Category: Stocks
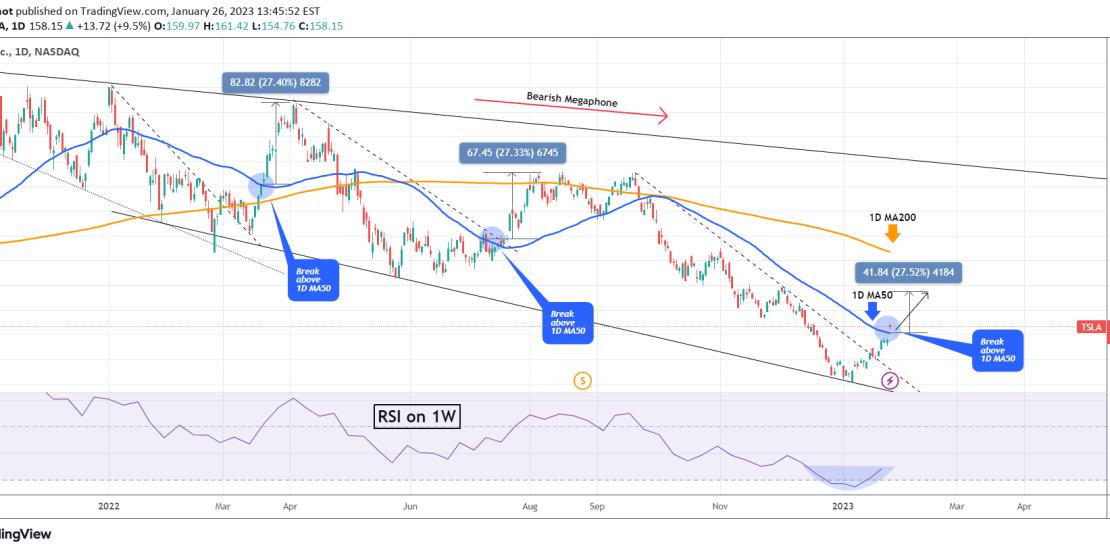
Tesla Inc (TSLA) broke today above its 1D MA50 (blue trend-line) for the first time since September 22 2022. This is a major bullish break-out on the medium-term as every time it did so inside the long-term Bearish Megaphone pattern, the price rose by around +27.50%. The 1W RSI is on a bullish reversal bottom
-
META The worst is history! 6 straight green weeks.
- January 22, 2023
- Posted by: Tradingshot Articles
- Category: Stocks
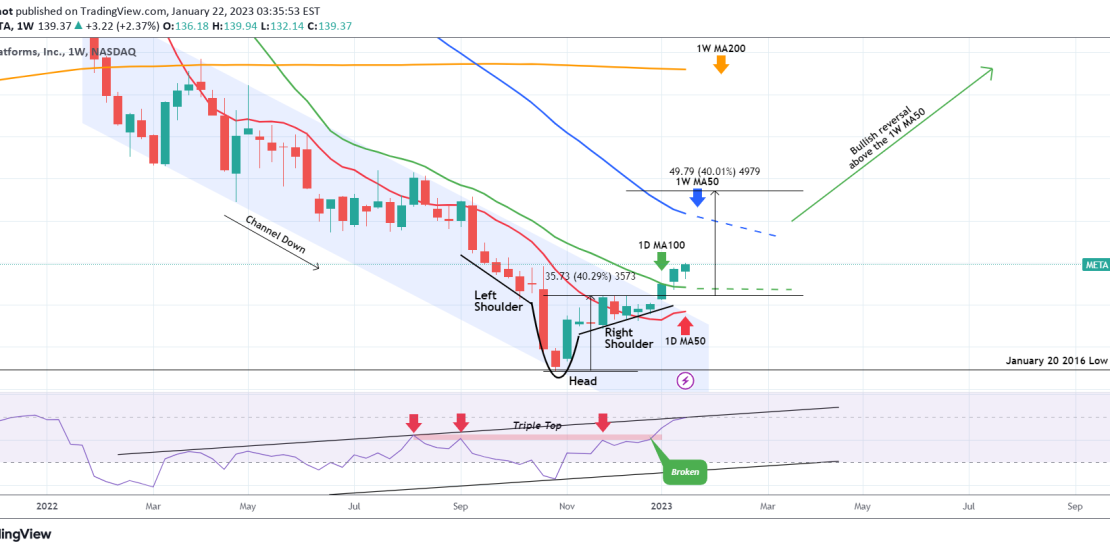
Our update on The Meta Platforms (META) on the 1W time-frame. What stands out is that the stock has completed six (6) straight weekly candles, for the first time since March 2017! This is one of the strongest bullish sequences in its history and while at it, it has established 2 weeks above the 1D
-
META Closed 2 straight green months, the first time since 2021!
- January 10, 2023
- Posted by: Tradingshot Articles
- Category: Stocks
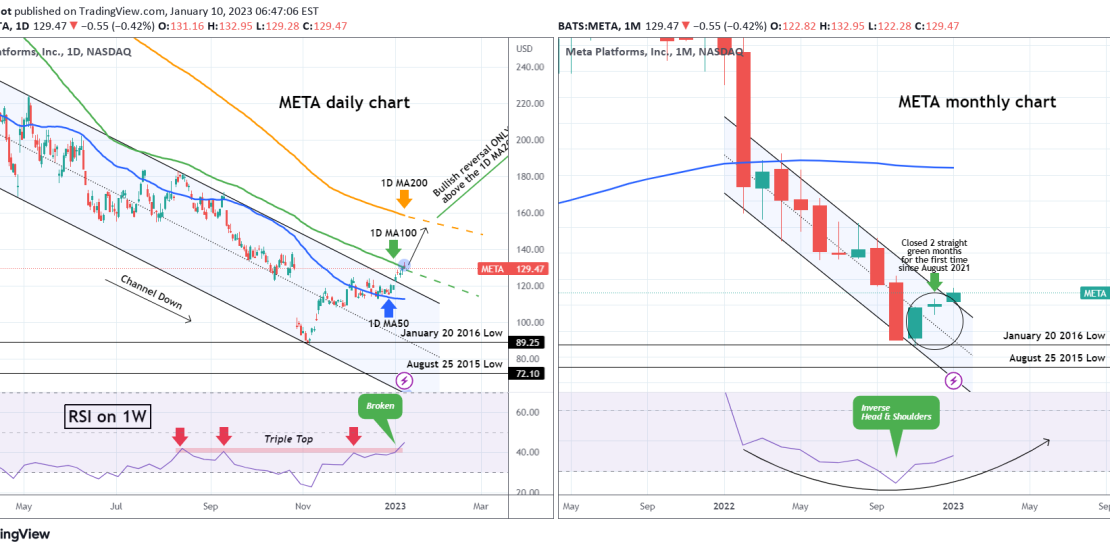
Meta Platforms (META) is on a strong January monthly candle (chart on the right) having closed in December two straight green months for the first time since August 2021, which was its All Time High. This alone is a huge bullish development, which along with the 1M RSI being on an Inverse Head and Shoulders
