

- May 31, 2022
- Posted by: Tradingshot Articles
- Category: Forex
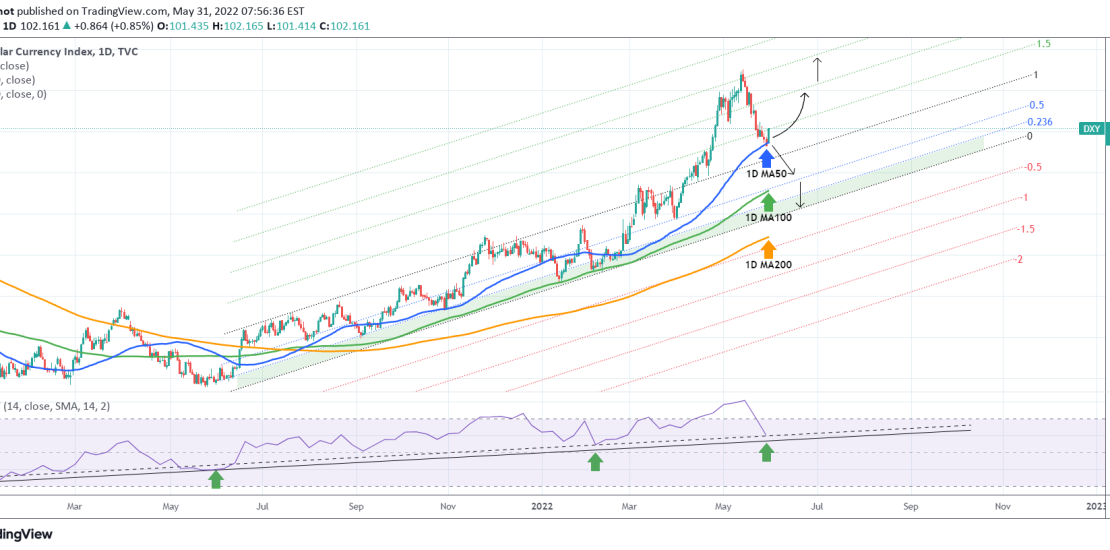
The U.S. Dollar Index (DXY) hit yesterday the 1D MA50 (blue trend-line) for the first time since February 23. Today’s rebound simply shows why this MA level is considered such an important short/ medium-term Support. As long as it holds, expect a rebound to the upper Fibonacci extension levels of 2.0 and 2.5 that previously led to the May 13 High.
A weekly closing below the 1D MA50 though would mean an extension of this correction towards the 1D MA100 (green trend-line), which acted as a Support on Feb 10 and the 1D MA200 (orange trend-line), which has been untouched since June 23 2021.
Pay very close attention to the RSI on the 1W time-frame on the pane below the chart as it is testing the Higher Lows trend-line that practically started this aggressive multi-month trend back in January 2021.
Tradingview link: