

-
US02Y is on a breaking point. Great news for stocks!
- March 14, 2023
- Posted by: Tradingshot Articles
- Category: Other
No Comments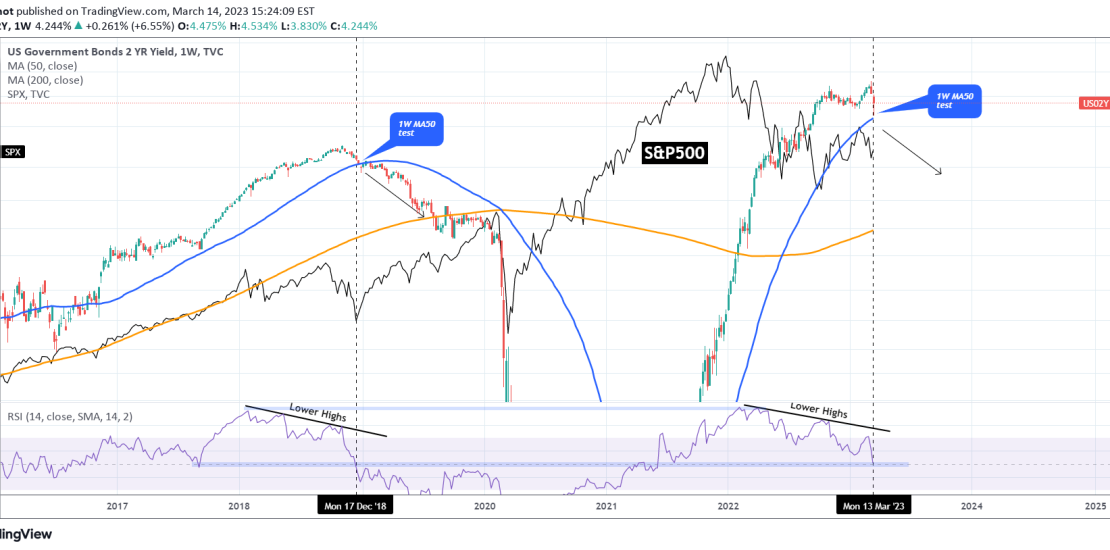
The U.S. Government Bonds 2 YR Yield (US02Y) is testing its 1W MA50 (blue trend-line) for the first time since May 31 2021. The 1W RSI is on the very same Lower Highs trend-line rejection that it was during the December 17 2018 1W MA50 test! Needless to say this shows that the price is
-
US10Y Double rejection. Targeting the 1D MA200.
- March 6, 2023
- Posted by: Tradingshot Articles
- Category: Other
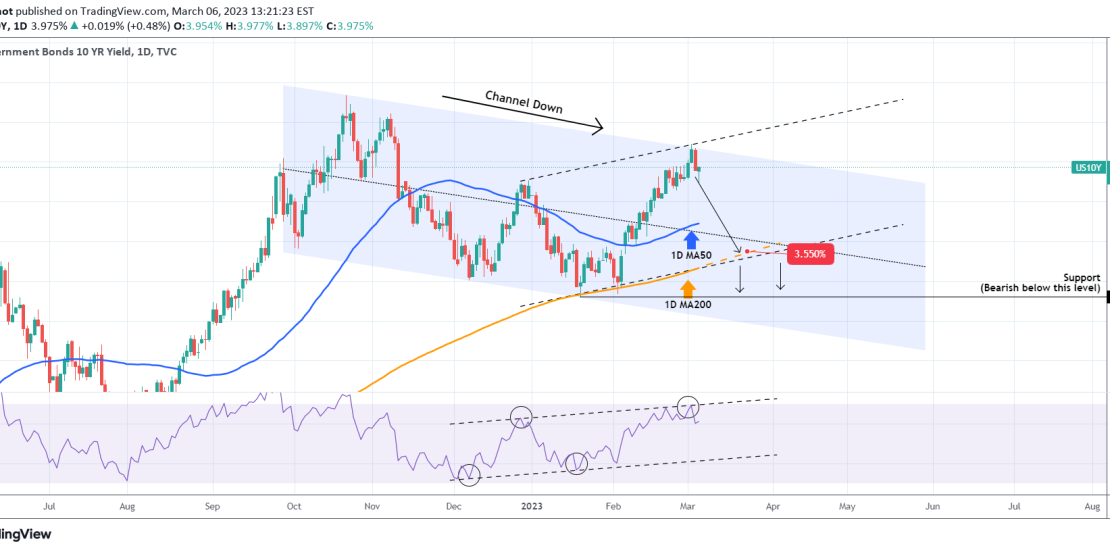
The U.S. Government Bonds 10YR Yield (US10Y) has been trading within a Channel Down pattern ever since the October 21 2022 High and even though there might be a Diverging Channel Up (dashed lines) emerging, the current level makes a strong Resistance cluster. With the 1D RSI also rejected twice on its Higher Highs trend-line,
-
US10Y Rejection cluster. Targeting the 1D MA200 again.
- February 27, 2023
- Posted by: Tradingshot Articles
- Category: Other
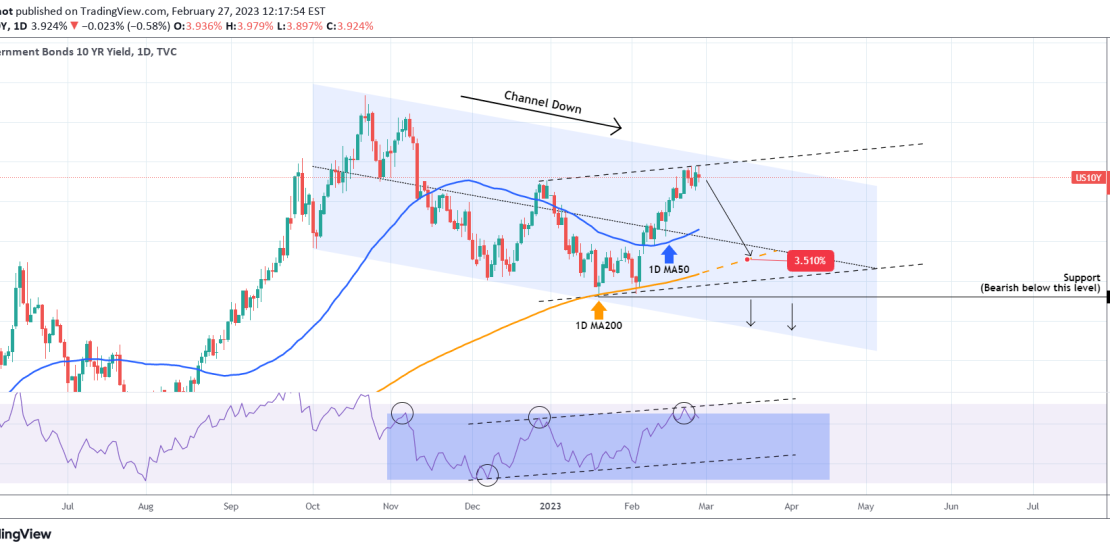
The U.S. Government Bonds 10YR Yield (US10Y) has been trading within a Channel Down pattern ever since the October 21 2022 High and even though there might be a Diverging Channel Up (dashed lines) emerging, the current levels and the fact that it has failed to break higher in the last five 1D candles, make
-
US02Y is the key for stocks and it has started to drop!
- December 1, 2022
- Posted by: Tradingshot Articles
- Category: Other
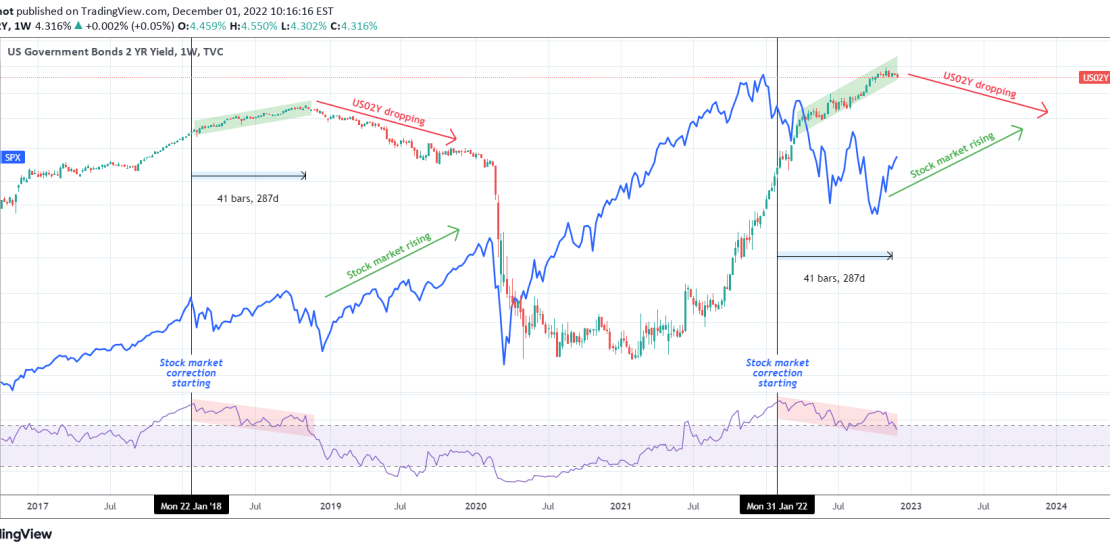
This is a 1W time-frame chart, showing the correlation between the U.S. Government Bonds 2 YR Yield and the S&P500 (blue trend-line). Some may perceive the recent 2-month rally on stocks as a coincidence but the US02Y price action shows that it is not and has a direct correlation with it. The 1W RSI
-
US10Y Testing the 1D MA50 again
- June 30, 2022
- Posted by: Tradingshot Articles
- Category: Other
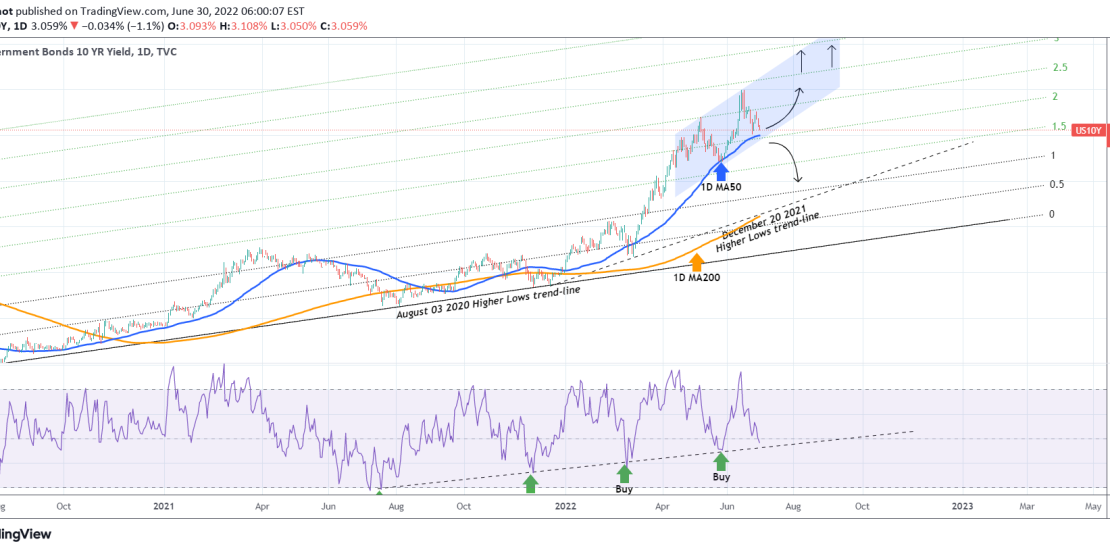
The U.S. Government Bonds 10 YR Yield (US10Y) has been on a pull-back in the past 2 weeks and is close to testing the 1D MA50 (blue trend-line) again. This held last time upon contact on May 26 and constitutes the first Support. We may have a Channel Up pattern in formation and the
-
INFLATION testing a 100 year old trend-line. How will S&P react?
- June 2, 2022
- Posted by: Tradingshot Articles
- Category: Other, Stock Indices
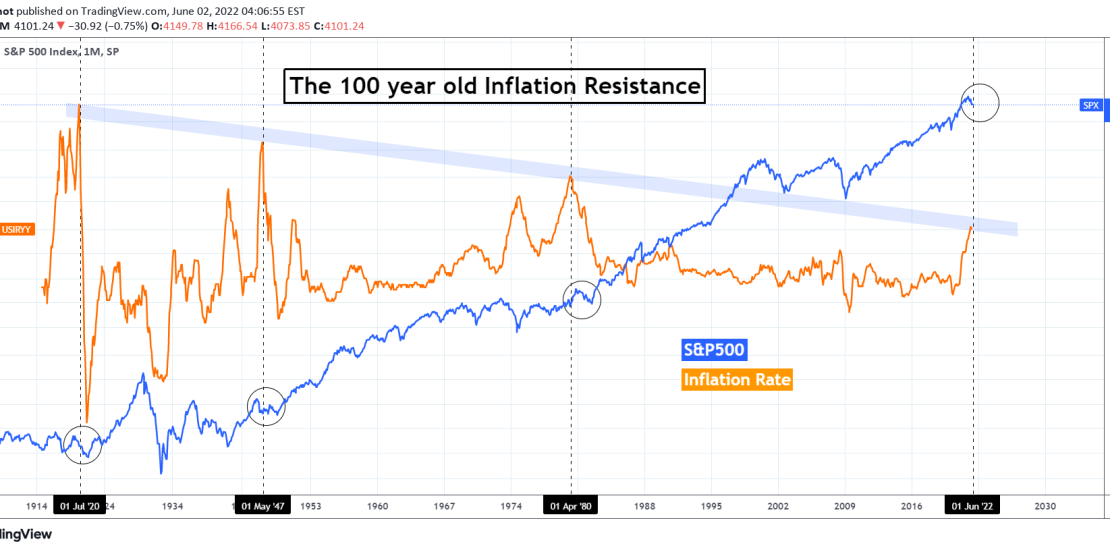
This is an interesting analysis as the U.S. Inflation Rate (orange trend-line) is testing for the first time since early 1980 a Lower Highs trend-line that started after the High of July 1920, exactly 100 years ago! This Lower Highs trend-line has made another 2 contacts after that and it is interesting to see
-
U.S. stocks crashing? If so which currencies to trade?
- January 24, 2022
- Posted by: Tradingshot Articles
- Category: Other, Stock Indices
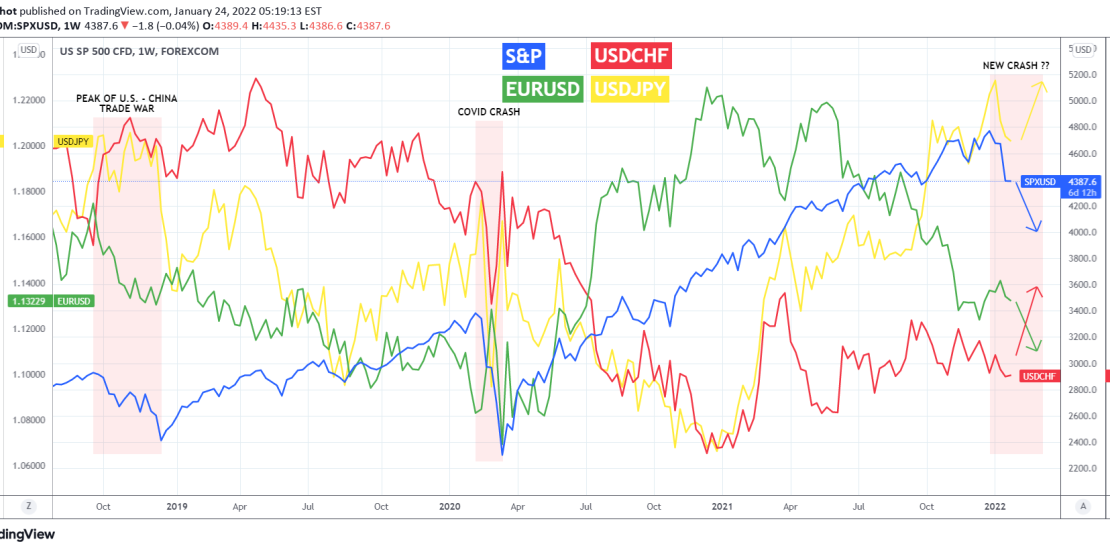
Last week was a very painful one for the U.S. (as well as global) stock markets, seeing the biggest sell-off since the March 2020 crash that was caused by the COVID outbreak panic. So if we are at the start or halfway of a typical correction on the stock markets, which currencies should we
-
US10Y Signs of a bearish reversal.
- October 25, 2021
- Posted by: Tradingshot Articles
- Category: Other
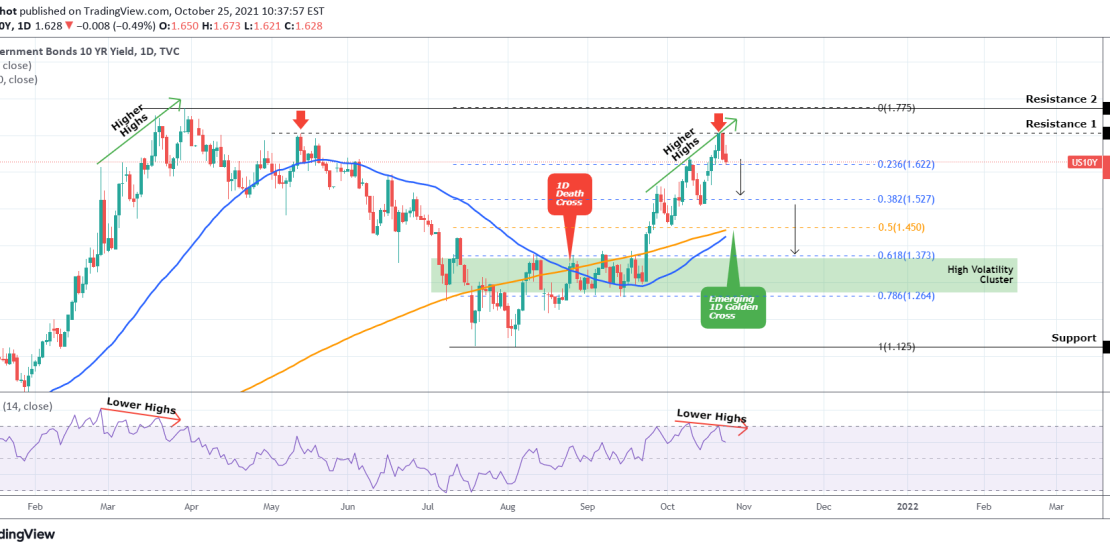
The US10Y has reached (and so far got rejected on) the 1.707 Resistance (1), which last time rejected the price on May 13. With the 1D RSI on a Bearish Divergence (is on Lower Highs while the actual price is on Higher Highs), similarities can be made with the February 25 – March 30
-
US10Y Medium-term sell
- July 13, 2021
- Posted by: Tradingshot Articles
- Category: Other
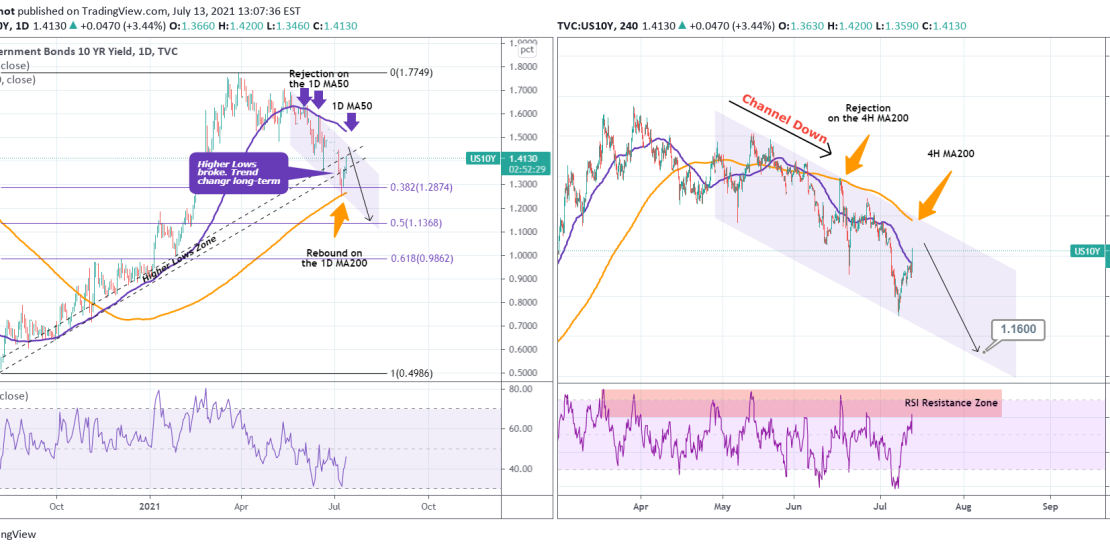
The US10Y has confirmed the shift from bullish to long-term bearish as last week it broke below the Higher Lows Zone that has been holding since the August 07, 2020 bottom. The bounce however on the 1D MA200 (orange trend-line on the left chart) is something to keep an eye on, but for the
-
BONDS 10year yield formed the 1st 4H Death Cross since September
- April 21, 2021
- Posted by: Tradingshot Articles
- Category: Other
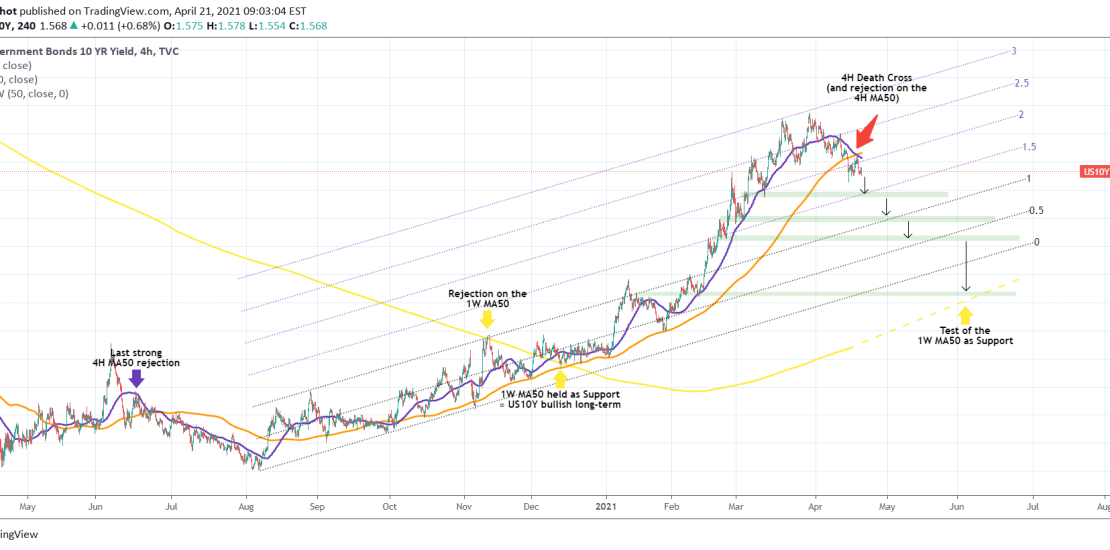
The US10Y has just formed a Death Cross (the MA50 (blue trend-line) crossing below the MA200 (orange trend-line)) on the 4H time-frame since September 24, 2020!. That is technically a bearish formation. It gets even more bearish if we count the fact that the price got rejected on the 4H MA50 after the bounce.