

2022 October
-
OKBUSDT About to make a huge bullish break-out!
- October 31, 2022
- Posted by: Tradingshot Articles
- Category: Cryptocurrency
No Comments
The OKB token (OKBUSDT) is the Global Utility Token that was launched by the OK Blockchain Foundation and OKX exchange in 2017, to serve as a bridge to connect OKX and its users. On this post, we will analyze how current pattern may be bullish short-term against popular belief and how it may play
-
APEUSDT Neutral within the Triangle. Wait for break-out.
- October 31, 2022
- Posted by: Tradingshot Articles
- Category: Cryptocurrency
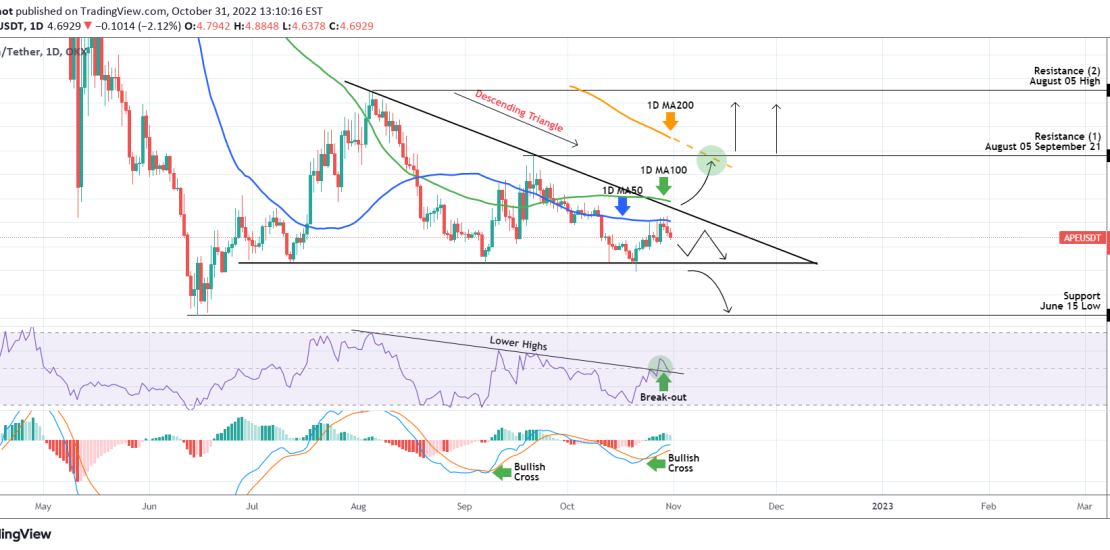
*** *** For this particular analysis on ApeCoin we are using the APEUSDT symbol on the OKX exchange. *** *** The idea is on the 1D time-frame where APE has been trading within a Descending Triangle pattern since the June 30 Low that started its Support. As you see the late price action is limited below the 1D MA50 (blue
-
XCNUSDT Rise short-term but still limited unless this breaks.
- October 31, 2022
- Posted by: Tradingshot Articles
- Category: Cryptocurrency
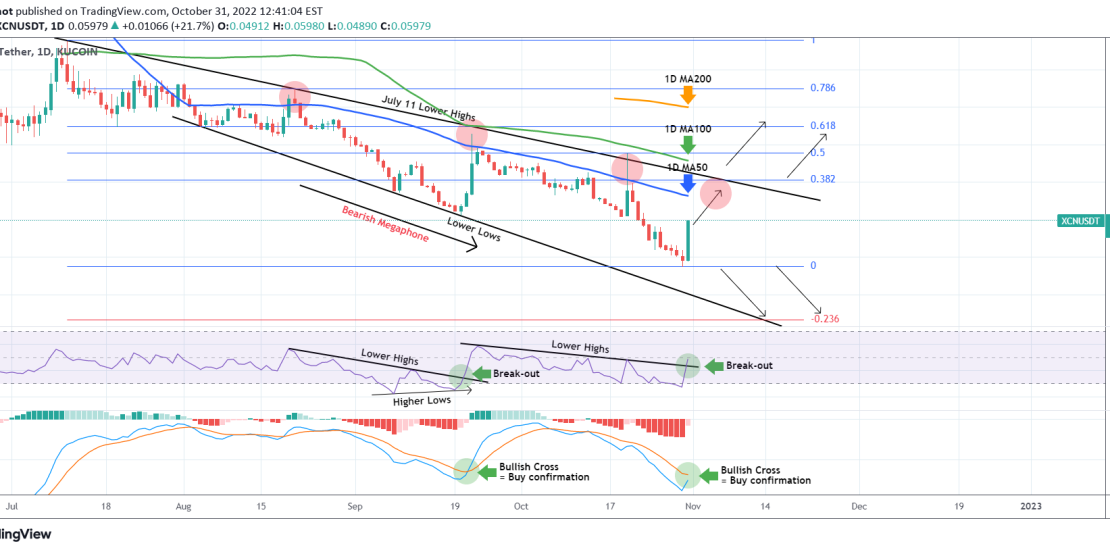
Chain (XCNUSDT) followed the pattern we suggested 40 days ago and after a short rise it dropped to the -0.236 Fibonacci extension level: As you see, today is having a +22% rise. The long-term pattern is a Bearish Megaphone on this 1D time-frame. This short-term rebound is aiming at the 1D MA50 (blue trend-line),
-
EURUSD Short-term Channel Up after the 1D MA100 rejection.
- October 31, 2022
- Posted by: Tradingshot Articles
- Category: Forex
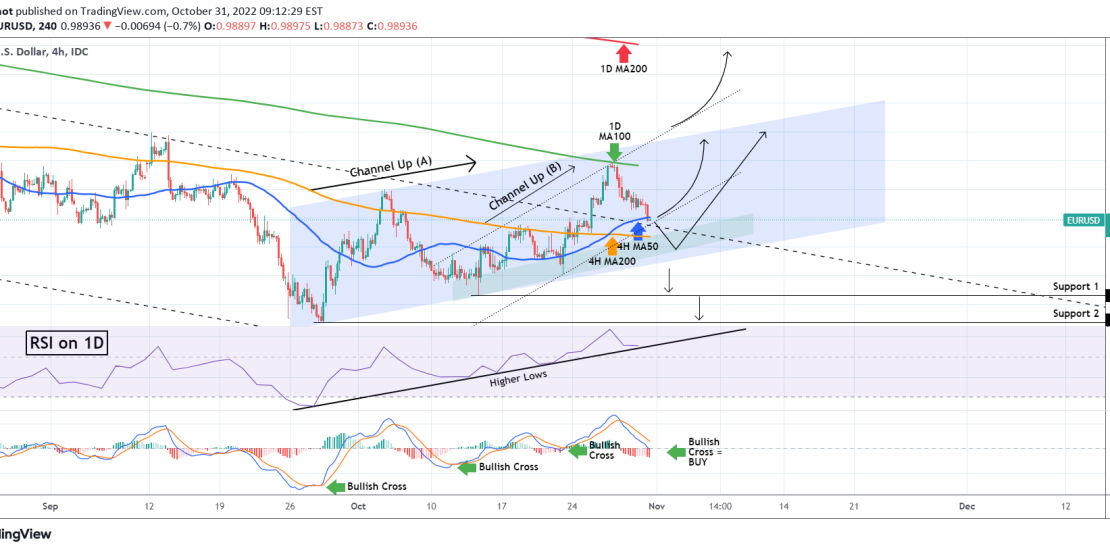
The EURUSD pair got emphatically rejected on its 1D MA100 (green trend-line) last Wednesday and as we discussed in our previous analysis, that was an instant short-term sell. Now the price is testing the 4H MA50 (blue trend-line), which along with the 4H MA200 (orange trend-line) form the short-term Support Zone. The rejection, confirmed
-
BITCOIN Fibonacci charts the new Bull Cycle! It’s already began!
- October 31, 2022
- Posted by: Tradingshot Articles
- Category: Cryptocurrency
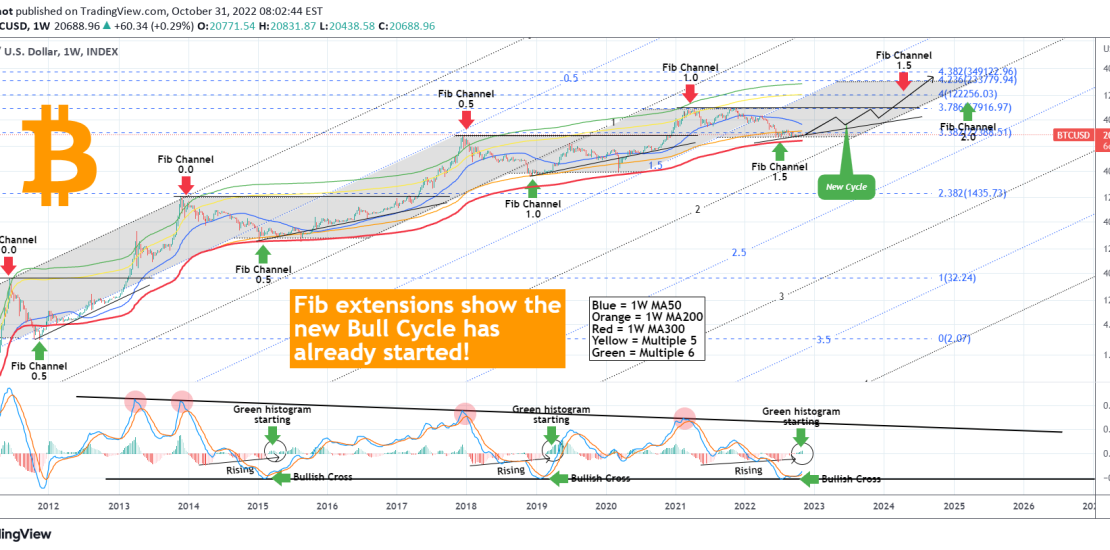
This is Bitcoin (BTCUSD) on the 1W time-frame displaying all of its Cycles historically. I’ve used the Fibonacci Channel extensions to identify any possible correlations and how this can create a roadmap moving forward and project the next Cycle. To start putting the chart’s indicators into perspective, the 1W MA50 is the blue trend-line,
-
DXY Can the Dollar keep falling ahead of next week’s Fed Rate?
- October 28, 2022
- Posted by: Tradingshot Articles
- Category: Forex
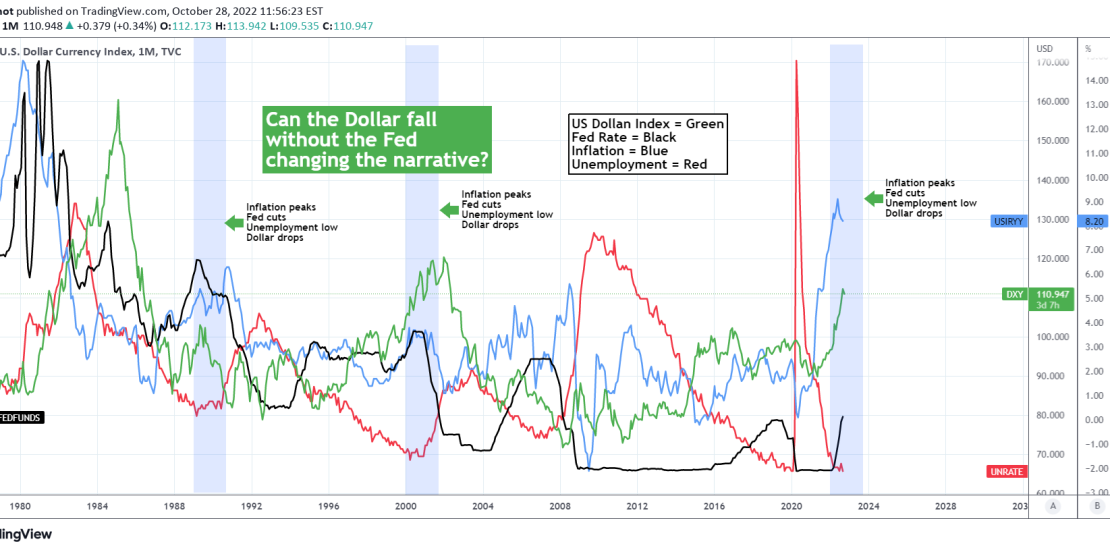
This 1M chart focuses on the U.S. Dollar Index (green trend-line), which is seeing its first serious and sustainable pull-back after a long time as since September 28 it has been trading on Lower Highs and Lower Lows (not seen on this monthly time-frame though). This week the low completed a -4.50% from its
-
BITCOIN The winning signal for the new Bull Cycle!
- October 28, 2022
- Posted by: Tradingshot Articles
- Category: Cryptocurrency
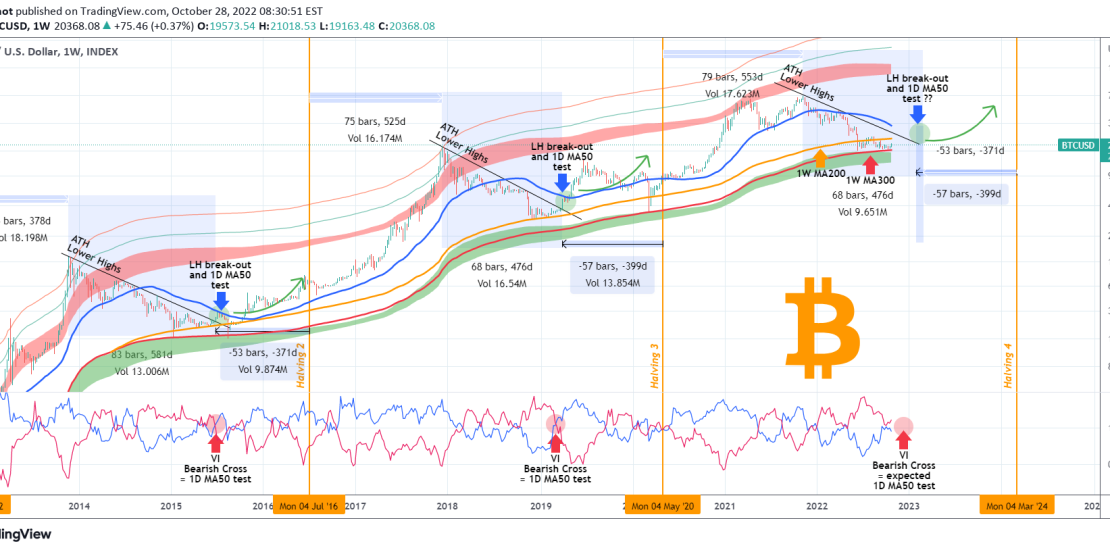
This is Bitcoin (BTCUSD) on the 1W time-frame, where we will be basically adding elements and making an extension of our June 17 idea that projected the bottom on the 1W MA300 (red trend-line): As you see, BTC hit the 1W MA300, the Ultimate Support Band as we called it and since then traded
-
NETFLIX gives a confirmed MEGA BUY signal
- October 27, 2022
- Posted by: Tradingshot Articles
- Category: Stocks
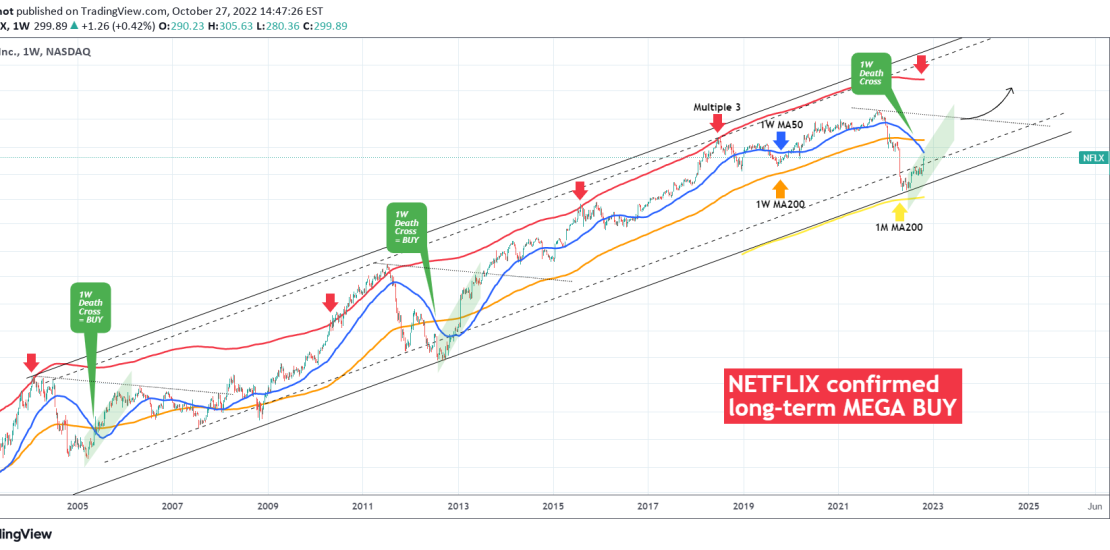
We’ve been bullish on Netflix (NFLX) since early Summer after the price held the 1M MA200 (yellow trend-line), which as we noted on our April 21 analysis, is the historical Support: Even though the drop didn’t complete the expected -80% drop, it did come close enough (-76.50%) and as you see the rebound since
-
CADCHF Previous Target hit. Sell now, unless breakout happens.
- October 27, 2022
- Posted by: Tradingshot Articles
- Category: Forex
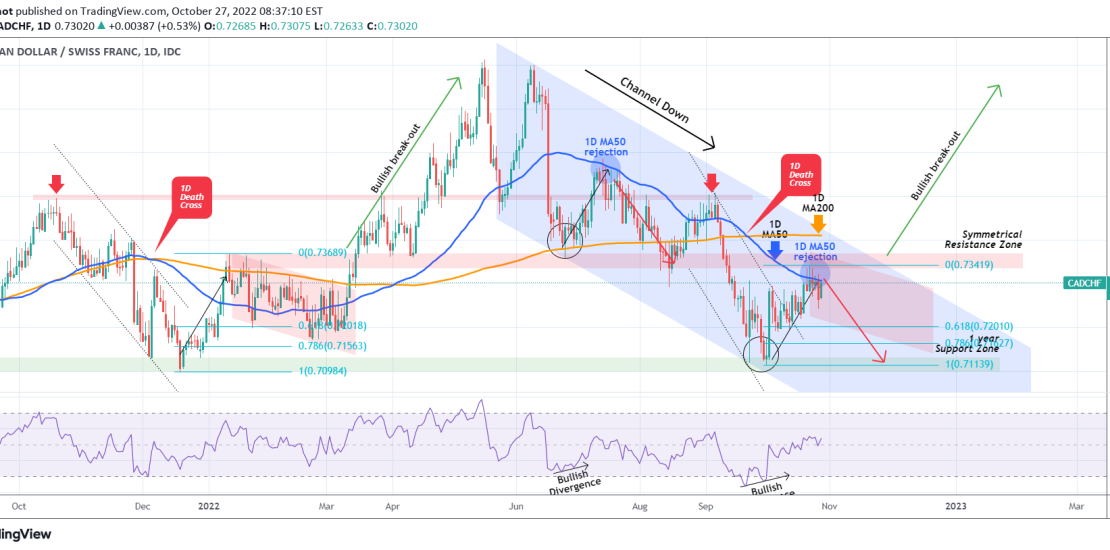
The CADCHF pair gave us a perfect buy 1 month ago after we spotted the RSI Bullish Divergence and the price rebounded strongly on the 1 year Support Zone: Our 1D MA50 (blue trend-line) target was successfully hit and now we see the price struggling to close above it. This continues to print the
-
USDZAR Short-term Sell signal and long-term level to watch.
- October 27, 2022
- Posted by: Tradingshot Articles
- Category: Forex
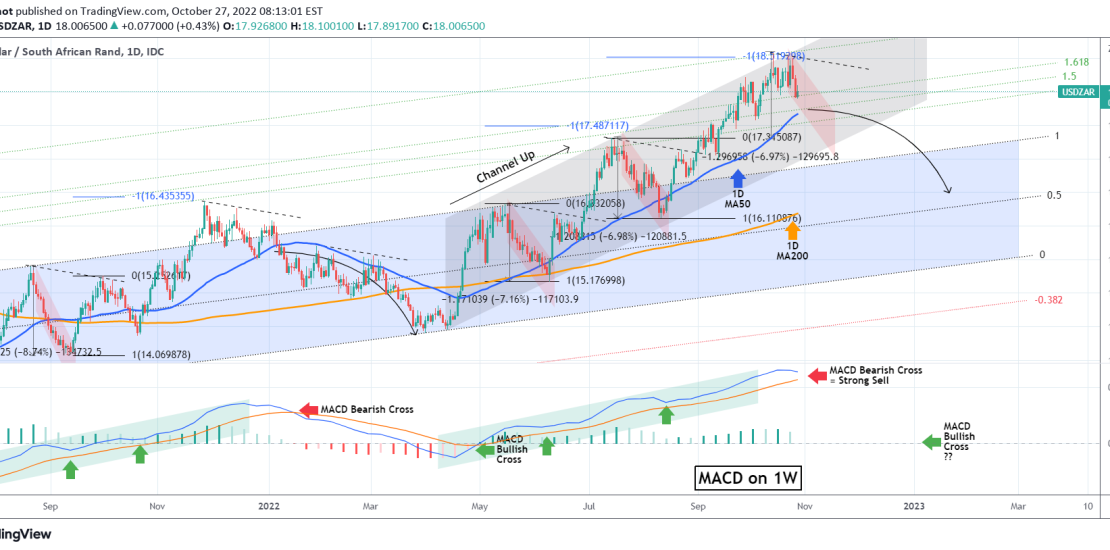
The USDZAR pair continues to confirm our break-out trade strategy as by breaking above the previous Resistance Zone we discussed on September 06, while holding the 1D MA50 (blue trend-line) as Support, it activated our buy signal and hit the -1.0 Fibonacci target and the 2.0 Fib extension (green dotted line) of the long-term