- October 28, 2022
- Posted by: Tradingshot Articles
- Category: Cryptocurrency

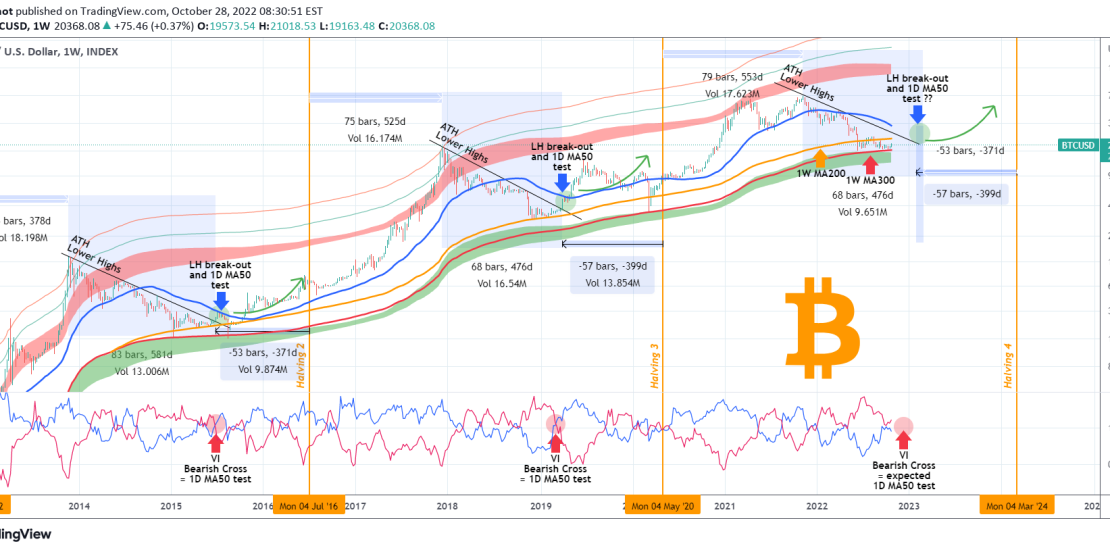
This is Bitcoin (BTCUSD) on the 1W time-frame, where we will be basically adding elements and making an extension of our June 17 idea that projected the bottom on the 1W MA300 (red trend-line):
As you see, BTC hit the 1W MA300, the Ultimate Support Band as we called it and since then traded sideways in our designated Bottom Phase. On the current analysis, we are taking a slightly different approach, still focusing around the Halvings but also introducing new key Resistance trend-lines as well as the the element of the Vortex Indicator (VI).
** The ATH Lower Highs and 1D MA50 test **
The price is having a bullish week so far that took a stop yesterday. Still, we don’t have a major break-out yet, as it is not only below the 1D MA200 (orange trend-line) but the 1D MA50 (blue trend-line) as well. The chart shows that the first major bullish break-out in Bitcoin’s past Bear Cycles occurred when the price broke above the All Time High (ATH) Lower Highs trend-line, after which it immediately tested the 1D MA50. The 1D MA50 typically broke after some consolidation.
** The Vortex Indicator signal **
A critical indicator that basically confirmed the ATH Lower Highs break-out was when the 1W Vortex Indicator (VI) made a Bearish Cross (red line crossing below the blue). In past Cycles this Cross took place right on the LH break-out, practically calling for the 1D MA50 test next. We can see that the past two Cycles made the LH break-out 55 weeks on average before the next Halving. The next Halving (no 4) will be in early March 2024. That gives us a projected range for the LH break-out and 1D MA50 test within the Jan 30 2023 and Feb 27 2023 1W candles. With the VI diverging from a Cross, it confirms so far this scenario.
Do you agree with the above model? Is a break above the ATH Lower Highs the roadmap to follow into the new Bull Cycle and if yes will it come when the model predicts or earlier if the VI makes a Bearish Cross? Feel free to let me know in the comments section below!
Tradingview link:
https://www.tradingview.com/chart/BTCUSD/t0xJE0cV-BITCOIN-The-winning-signal-for-the-new-Bull-Cycle


