

- October 31, 2022
- Posted by: Tradingshot Articles
- Category: Cryptocurrency
*** ***
For this particular analysis on ApeCoin we are using the APEUSDT symbol on the OKX exchange.
*** ***
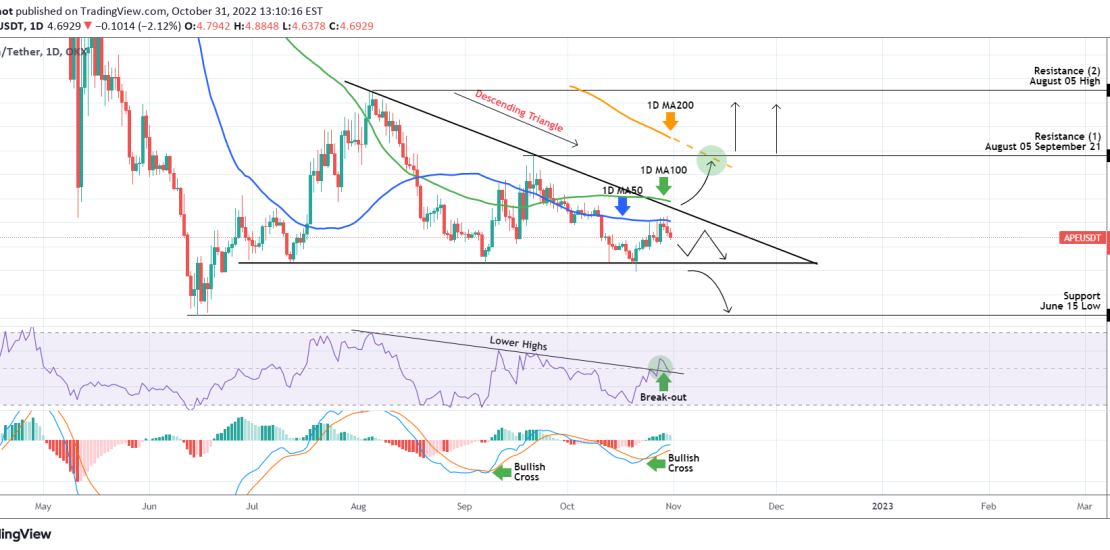
The idea is on the 1D time-frame where APE has been trading within a Descending Triangle pattern since the June 30 Low that started its Support. As you see the late price action is limited below the 1D MA50 (blue trend-line) and continues to trade sideways into its eventual exhaustion.
The 1D RSI has already made a break above its Lower Highs and the MACD a Bullish Cross so we are waiting for a break above the 1D MA100 (green trend-line) that will confirm the bullish sentiment and target the 6.3950 Resistance (1), where most likely will make contact with the 1D MA200 (orange trend-line) as well. A closing above it also further targets the 7.7700 Resistance (2), which is the top of the Triangle.
On the other hand a closing below the Triangle’s bottom (4.1550), would be a bearish signal targeting the 3.0700 Support (June 15 Low).
Tradingview link: