

- October 31, 2022
- Posted by: Tradingshot Articles
- Category: Cryptocurrency
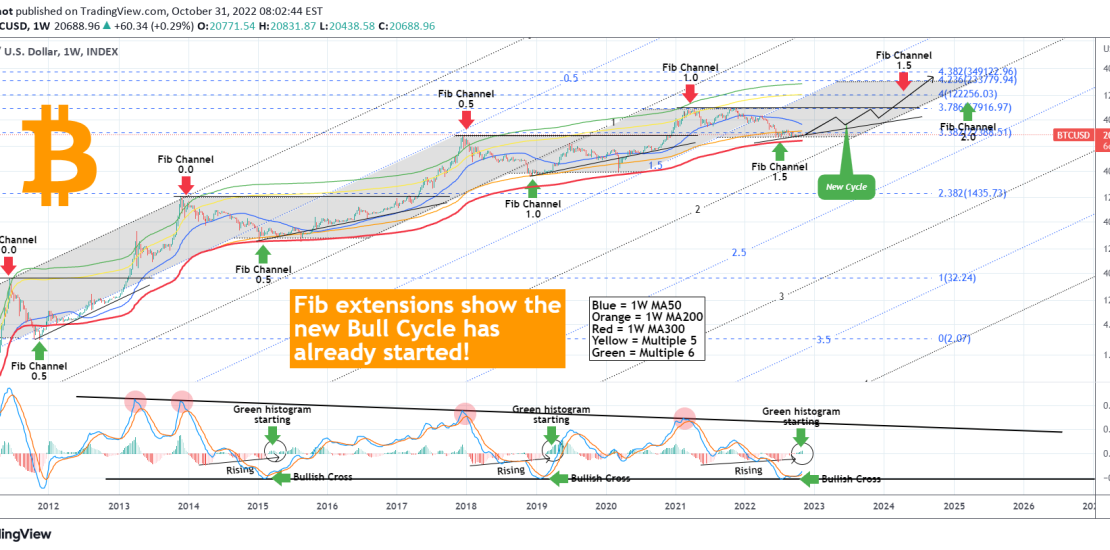
This is Bitcoin (BTCUSD) on the 1W time-frame displaying all of its Cycles historically. I’ve used the Fibonacci Channel extensions to identify any possible correlations and how this can create a roadmap moving forward and project the next Cycle. To start putting the chart’s indicators into perspective, the 1W MA50 is the blue trend-line, the 1W MA200 the orange, the 1W MA300 the red, while the yellow represents the Multiple 5 and the green the Multiple 6 of the Fib MA’s.
** The next High **
For starters, I’ve made several publications on why the +.382 (horizontal) Fibonacci extension roughly calculates the Highs. I’ve plotted that on this chart again and as you see so far the 2.382 Fibonacci extension has roughly predicted the December 2013 High while the 3.382 extension, the December 2017 High. The previous Cycle though broke that progression and topped on the 3.786 Fib extension instead. This means that the top of the next Cycle doesn’t have to be on the 4.382 Fib extension (roughly at $350k) but most likely will be in the lower 4.236 (230k) or even 4.0 (120k) tier.
** The Fibonacci Channel extensions **
But let’s circle back to how the Fibonacci Channel extensions can relate to these patterns. As you see, the first two Cycle Highs have been (naturally for the first) on the 0.0 Fib with bottoms outside of the 0.5 Fib. The High of the next Cycle was on the 0.5 Fib with the Low outside of the 1.0 Fib. The Highs of April 2021 and November 2021 were outside of Fib 1.0 and the Low of June 2022, closer to the middle of the 1.5 Fibonacci extension of the Channel.
This pattern, though not perfect, it shapes fairly well Bitcoin’s parabolic path over the years. Based on that, the next High should be either on or on the left of Fibonacci Channel extension 1.5 but most likely after its middle and the Low either on or left of extension 2.0 (probably middle).
** The Triangles and the bottom based on LMACD **
Notice also that all Cycles have traded inside an Ascending Triangle pattern until they hit their prior (All Time) High, and after turned parabolic for some months to complete the Cycle’s Top.
As for those who are unsure if June was the bottom and if a new Bull Cycle now is not plausible amidst the current high interest and inflationary fundamentals, they can seek answers, only technically, on the 1W LMACD. As you see, we have completed the Ultimate Bottom Pattern: Formed a Bullish Cross and after a red rising histogram narrowed down, it has turned into green territory. MACD-wise, there isn’t any other condition left to fill.
So if the bottom is in, is a top by late 2024 a wild projection to make? Can those Fibonacci Channel extensions identify the logarithmic path of Bitcoin and if so is $120k, $230k or $350k the next top? Feel free to let me know in the comments section below!
Tradingview link: