

2022 October
-
SILVER Can’t rise more unless this level breaks
- October 8, 2022
- Posted by: Tradingshot Articles
- Category: Commodities
No Comments
Silver (XAGUSD) has been pulling back in the last 3 days following an impressive +18% rise since the September 28 Low. As you see, we’ve charted Silver’s pattern since February 01 2021, which is a Channel Down, most effectively viewed using the Fibonacci channel levels. This is basically the pattern we used to analyze
-
OKBUSDT Death Cross can be bullish? The full picture.
- October 7, 2022
- Posted by: Tradingshot Articles
- Category: Cryptocurrency
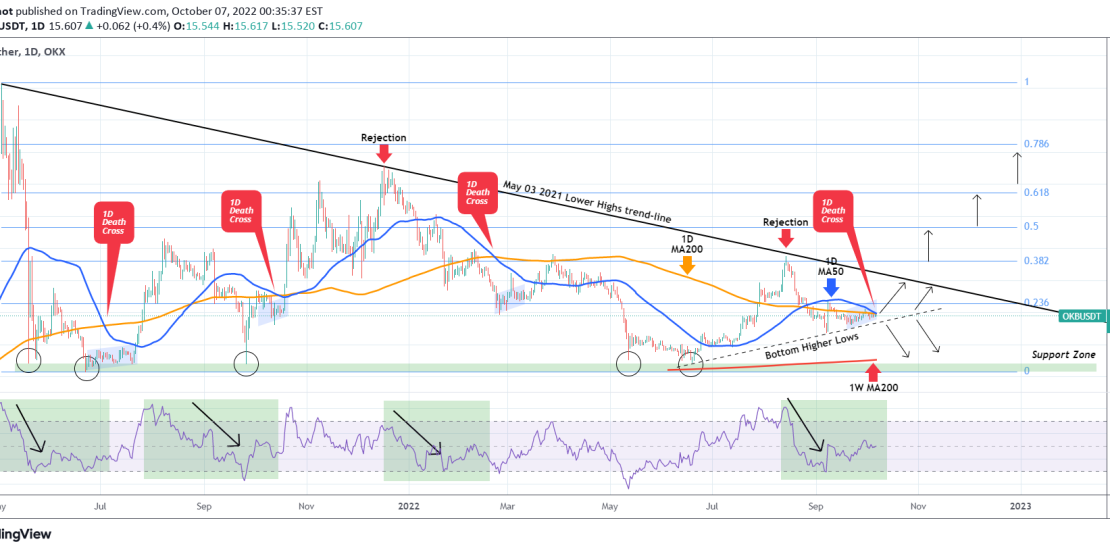
The OKB token (OKBUSDT) is the Global Utility Token that was launched by the OK Blockchain Foundation and OKX exchange in 2017, to serve as a bridge to connect OKX and its users. On this post, we will analyze how current pattern may be bullish short-term against popular belief and how it may play
-
XAUUSD First time to hit the 1D MA50 in 1.5 month. What next?
- October 5, 2022
- Posted by: Tradingshot Articles
- Category: Commodities
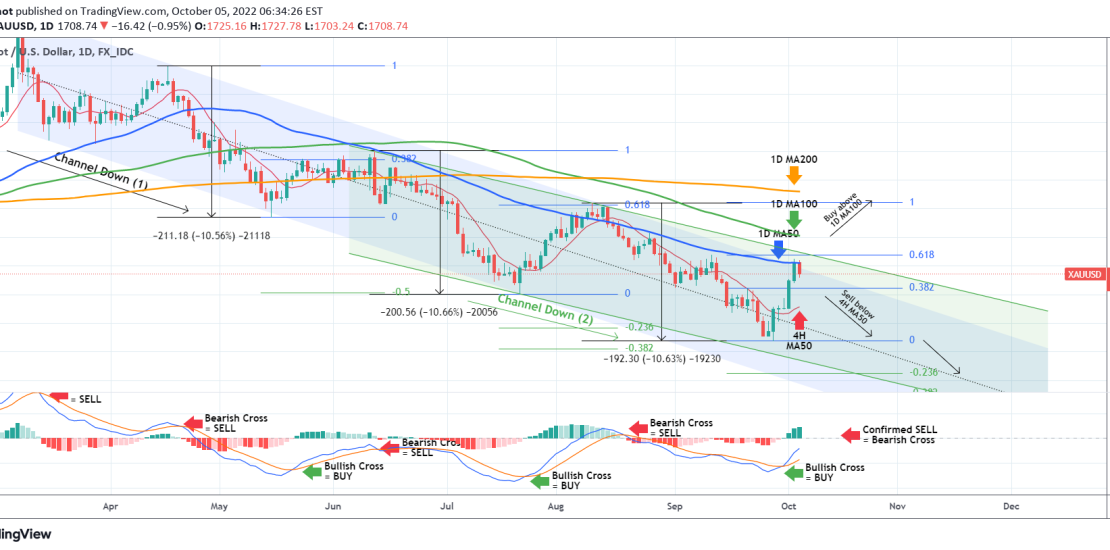
Last week (September 28) we posted our usual 1D Gold (XAUUSD) analysis, calling for a buy after the metal completed a -10.60% drop from its previous Channel Down High: As you see the price action validated that projection and Gold finally hit yesterday the 1D MA50 (blue trend-line), which was our immediate target. That
-
EURUSD Hit the 4H MA200 after 21 days. Rejection or break-out?
- October 4, 2022
- Posted by: Tradingshot Articles
- Category: Forex
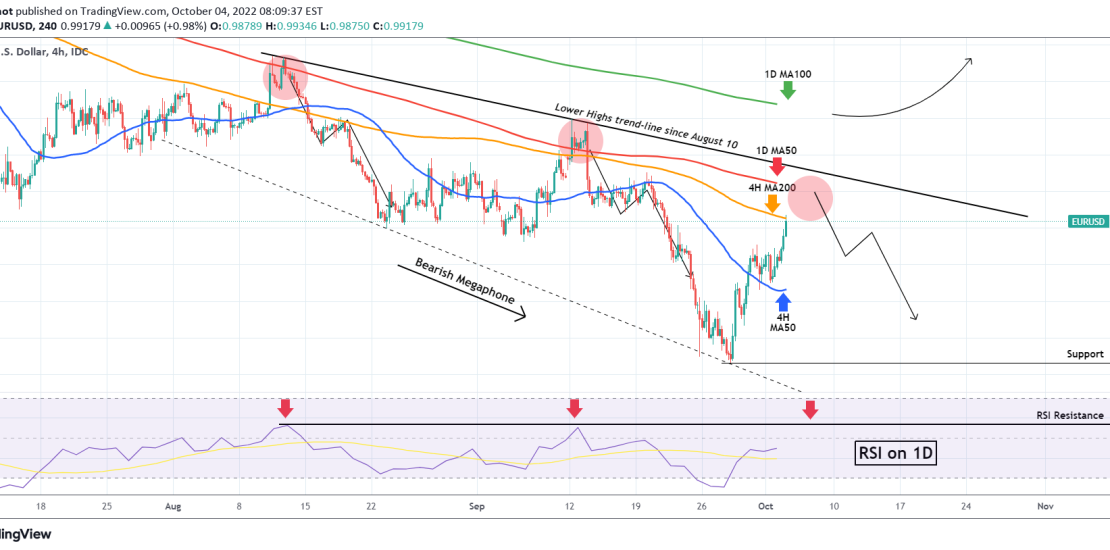
The EURUSD pair largely confirmed our Buy Signal given on our last week analysis at the bottom of the multi-month Channel Down: The price turned sideways after breaking above the 4H MA50 (blue trend-line) last Thursday, turning it now into a Support and hit the 4H MA200 (orange trend-line) for the first time since
-
WTI OIL Bullish break-out on the short-term
- October 3, 2022
- Posted by: Tradingshot Articles
- Category: Commodities
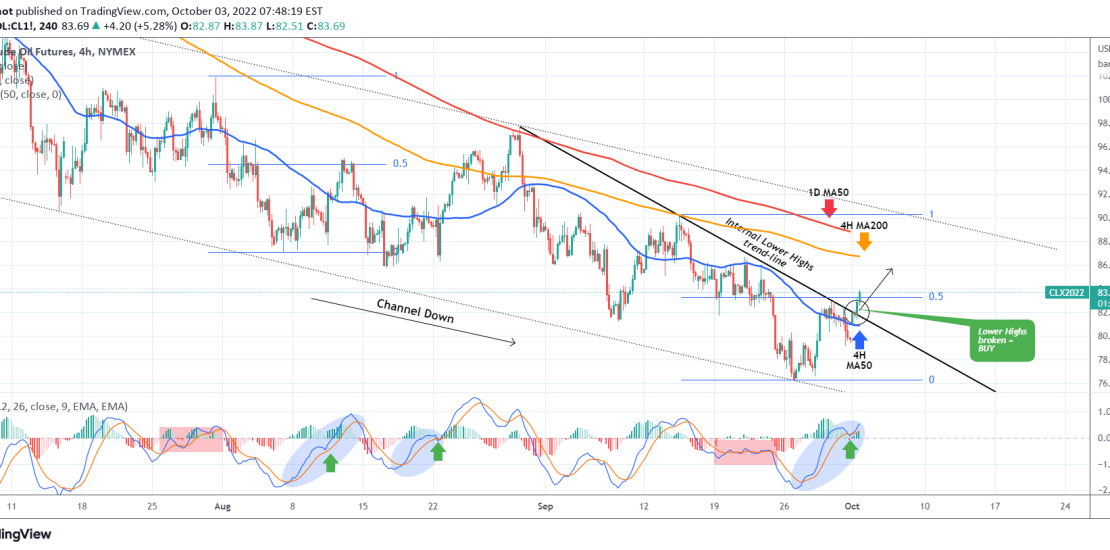
The WTI OIL (CL1! used on this analysis), broke today above the Internal Lower Highs trend-line that started on the last Lower High (August 30) of the long-term Channel Down pattern. By doing so, the price turned the 4H MA50 (blue trend-line) into a Support and technically targets the 4H MA200 (orange trend-line) as