

- October 31, 2022
- Posted by: Tradingshot Articles
- Category: Cryptocurrency
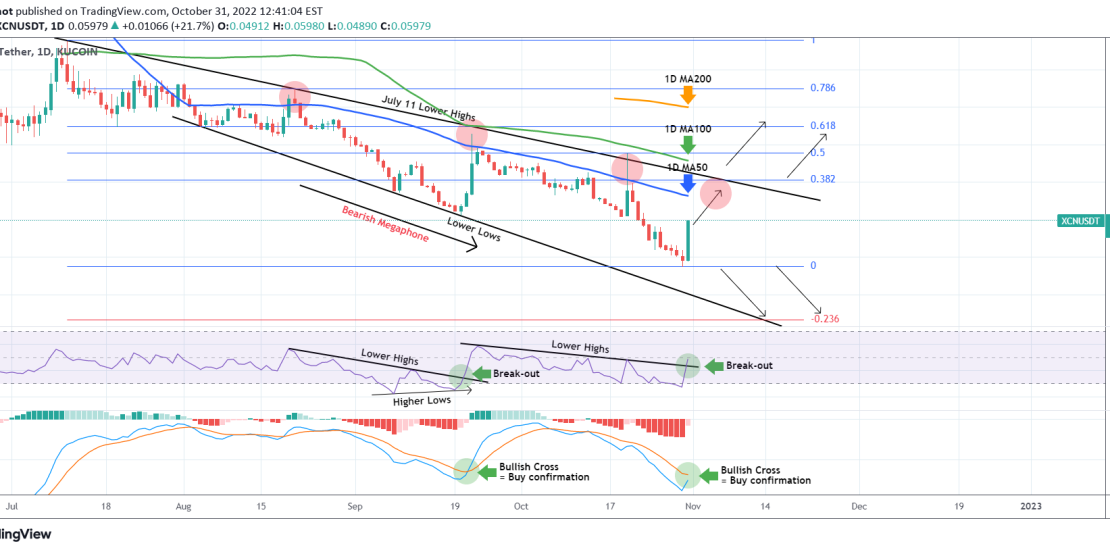
Chain (XCNUSDT) followed the pattern we suggested 40 days ago and after a short rise it dropped to the -0.236 Fibonacci extension level:

As you see, today is having a +22% rise. The long-term pattern is a Bearish Megaphone on this 1D time-frame. This short-term rebound is aiming at the 1D MA50 (blue trend-line), between which and the July 11 Lower Highs trend-line, all previous three Lower Highs were formed. This is our target but in order to engage in further buying, we need to see a break above the 1D MA100 (green trend-line), which is unbroken since July 11.
In that case, our target would be the 1D MA200 (orange trend-line), which potentially by that time should be near the 0.618 Fibonacci retracement level. In the event of a strong rejection on the Lower Highs trend-line such as on October 20, September 22 and August 21, we will treat it as a sell opportunity and target the 0.04765 Low and then the -0.236 Fibonacci extension again.
P.S. See how the aggressive rises take place when the 1D RSI breaks above its Lower Highs trend-line and the 1D MACD makes a Bullish Cross.
Tradingview link: