

- October 27, 2022
- Posted by: Tradingshot Articles
- Category: Forex
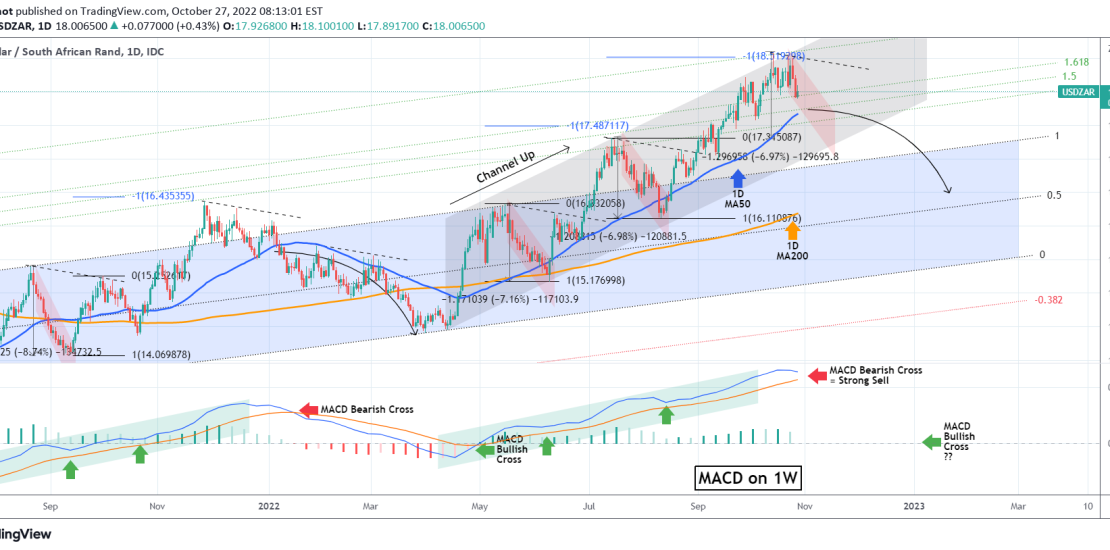
The USDZAR pair continues to confirm our break-out trade strategy as by breaking above the previous Resistance Zone we discussed on September 06, while holding the 1D MA50 (blue trend-line) as Support, it activated our buy signal and hit the -1.0 Fibonacci target and the 2.0 Fib extension (green dotted line) of the long-term Channel:

We will continue this successful approach, which right now gives a new short-term sell signal targeting roughly -7.00% from the recent top, below the 1D MA50 at the bottom of the Channel Up (green) that started on the April 13 Low. This is around 17.300.
If however the MACD on the 1W time-frame makes a Bearish Cross as on January 17 2022, we will use the 1D MA50 as Resistance and target even lower the 1D MA200 (orange trend-line). Take profit when the MACD makes a Bullish Cross.
Tradingview link: