

- October 27, 2022
- Posted by: Tradingshot Articles
- Category: Forex
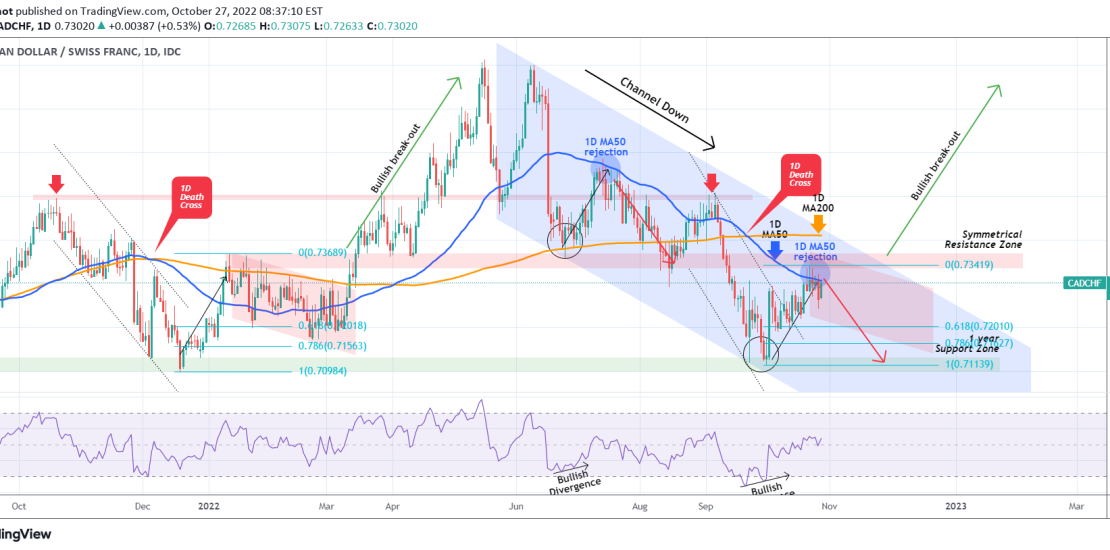
The CADCHF pair gave us a perfect buy 1 month ago after we spotted the RSI Bullish Divergence and the price rebounded strongly on the 1 year Support Zone:

Our 1D MA50 (blue trend-line) target was successfully hit and now we see the price struggling to close above it. This continues to print the same sequence as the fractal that helped us spot the Bullish Divergence in early July. As you see on July 13, that rebound within the Channel Down was also rejected on the 1D MA50 and pulled-back to make a Lower Low.
At the same time, its Symmetrical move that rebounded on the 1 Year Support also on December 20 2021, formed a short-term Channel Down (red pattern) that broke within the 0.618 – 0.786 Fibonacci Zone before rebounding above the Symmetrical Resistance Zone.
As a result, our moderate short-term Target is the 0.618 Fib at 0.7200 and are willing to buy only it the price breaks above the Symmetrical Resistance in which case we can long a strong rally targeting 0.7500, 0.7600, 0.7700 and 0.7800 in succession.
Tradingview link: