- October 28, 2022
- Posted by: Tradingshot Articles
- Category: Forex

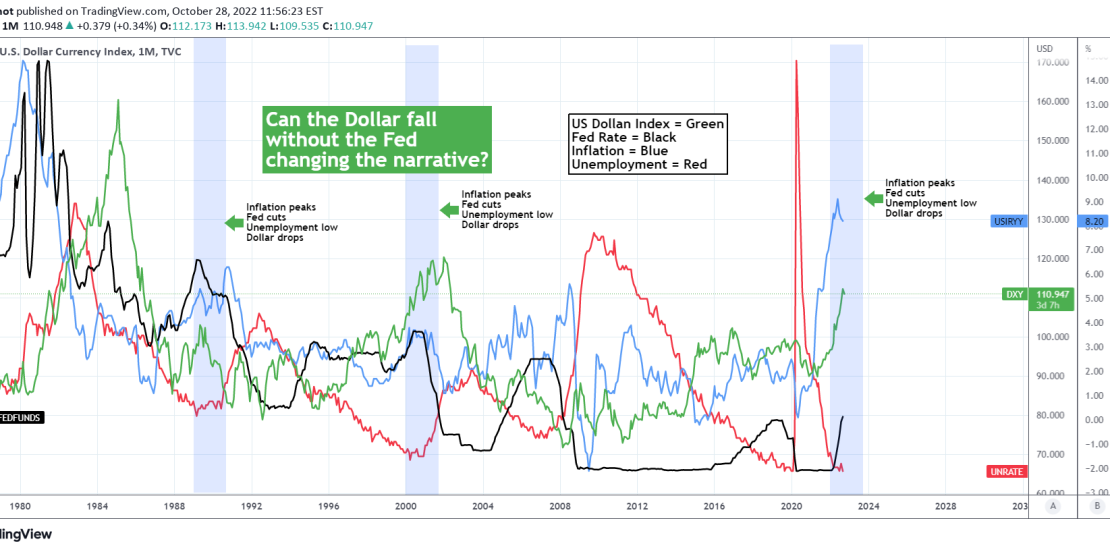
This 1M chart focuses on the U.S. Dollar Index (green trend-line), which is seeing its first serious and sustainable pull-back after a long time as since September 28 it has been trading on Lower Highs and Lower Lows (not seen on this monthly time-frame though). This week the low completed a -4.50% from its peak, which is the strongest pull-back since the January 05 2021 bottom! With the upcoming Fed Rate Decision next week, the question is, is it possible for the USD to continue falling without the Fed changing the narrative, i.e. without continue hiking (raising the rates)?
A simple answer would be no. That is because in general terms since the mid 80s, the USD and the Fed Interest Rate (black trend-line) have been strongly correlated. It is no surprise that the USD’s hyper strong rally this year started right when the Fed announced their hiking plan. Why they did that? In order to battle and bring down the raging inflation (blue trend-line) that came with the trillion dollar rescue packages during the COVID lockdowns. That is the key to our question before and provides a more detailed answer.
It is also important to consider the low unemployment rate (red trend-line) in this equation. As you see the only times in the past +30 years that we’ve had the Inflation peaking and pulling-back while the unemployment was bottom low and with the USD reversing, was when the Fed cut the Interest Rates after at least a year of hiking. So in order to complete the pattern we are currently in and see the USD extend its pull-back is to see the Fed cut back or at least adopt a more accommodative/ less aggressive hike with a specific horizon to stop. And the key to that as mentioned would be for them to be convinced that the current 3 month drop straight on the Inflation Rate is sustainable, thus under control.
Brace for a really really interesting week ahead.
Tradingview link:

