2022 November
-
RUNEUSD Is preparing a major bullish move
- November 29, 2022
- Posted by: Tradingshot Articles
- Category: Cryptocurrency
No Comments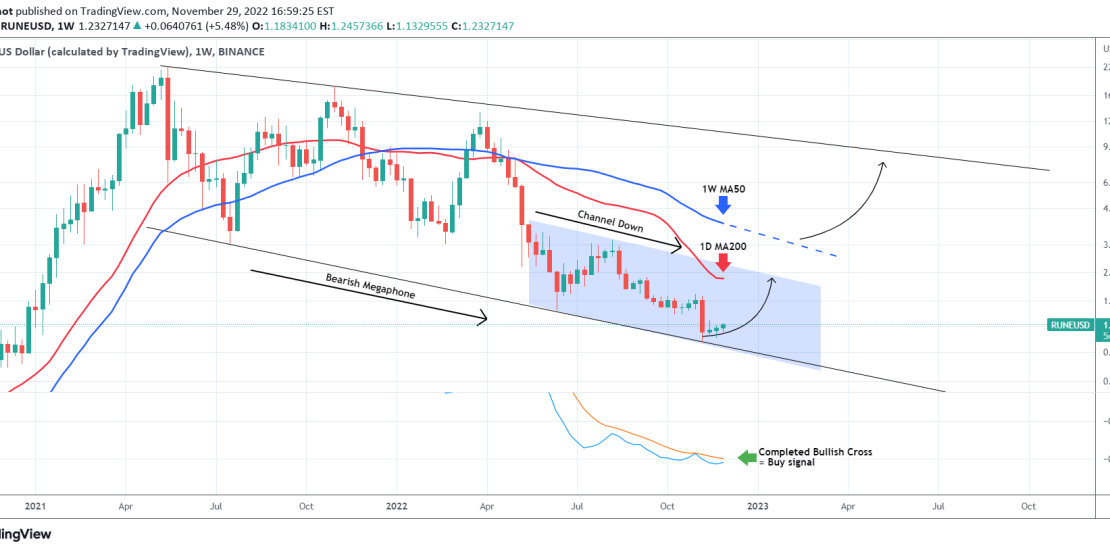
THORChain (RUNEUSD) has been trading within a Channel Down pattern since the June 13 2022 (weekly) low inside a longer-term Bearish Megaphone since the May 17 (weekly) High. The 1W LMACD is close to forming a Bullish Cross. If completed, the short-term target will be the 1D MA200 (red trend-line). A break above the
-
WALMART may be approaching the end of this rally
- November 29, 2022
- Posted by: Tradingshot Articles
- Category: Stocks
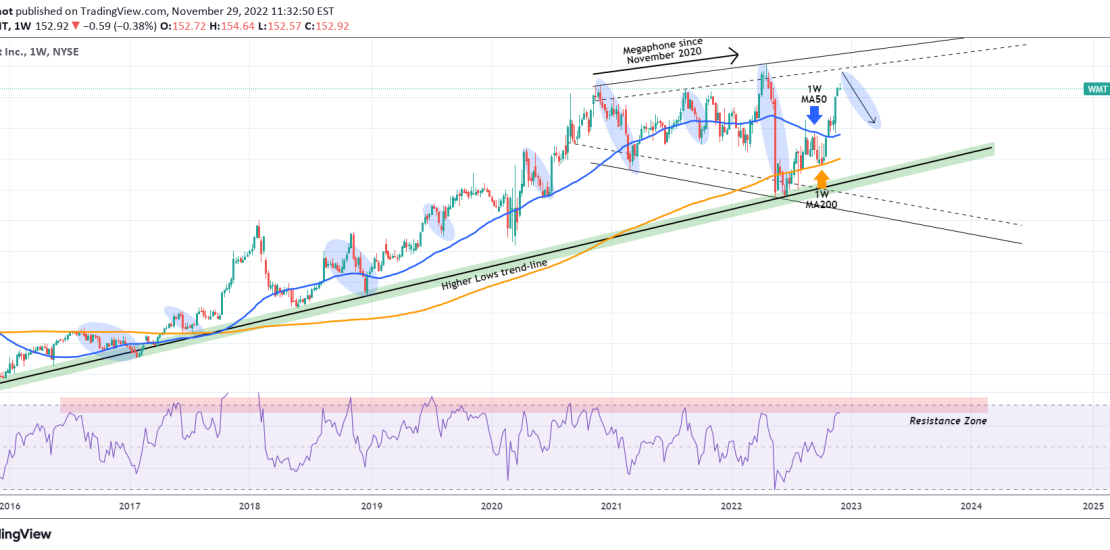
Walmart Inc. (WMT) has been rising since the low of the June 13 2022 weekly (1W) candle. Along the way it broke above the key Resistance of the 1W MA50 (blue trend-line) and after it held the 1W MA200 (orange trend-line), it has established both as Support levels long-term. There are however two longer
-
DAX ‘s incredible 8 straight green week rally may come to an end
- November 29, 2022
- Posted by: Tradingshot Articles
- Category: Stock Indices
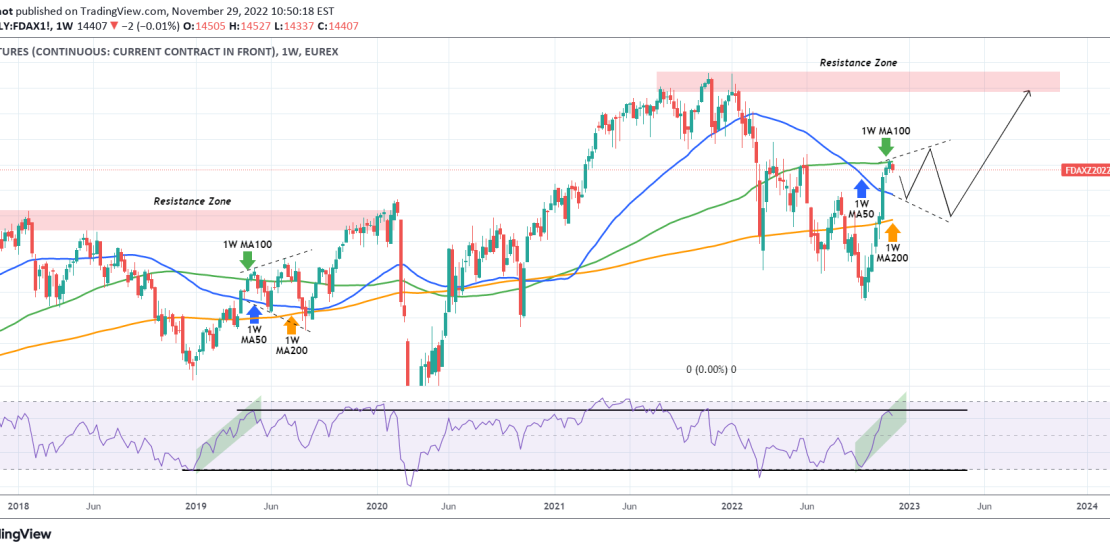
The German Index (DAX) hit last week its 1W MA100 (green trend-line) and early this week, the 1W candle is pulling-back in red. If it closes this way, it will be the first week of loss (red) since late September, running an amazing streak of 8 straight green ones. With the 1W RSI almost
-
BITCOIN Weekly RSI has bottomed and leads the way to 19k first.
- November 29, 2022
- Posted by: Tradingshot Articles
- Category: Cryptocurrency
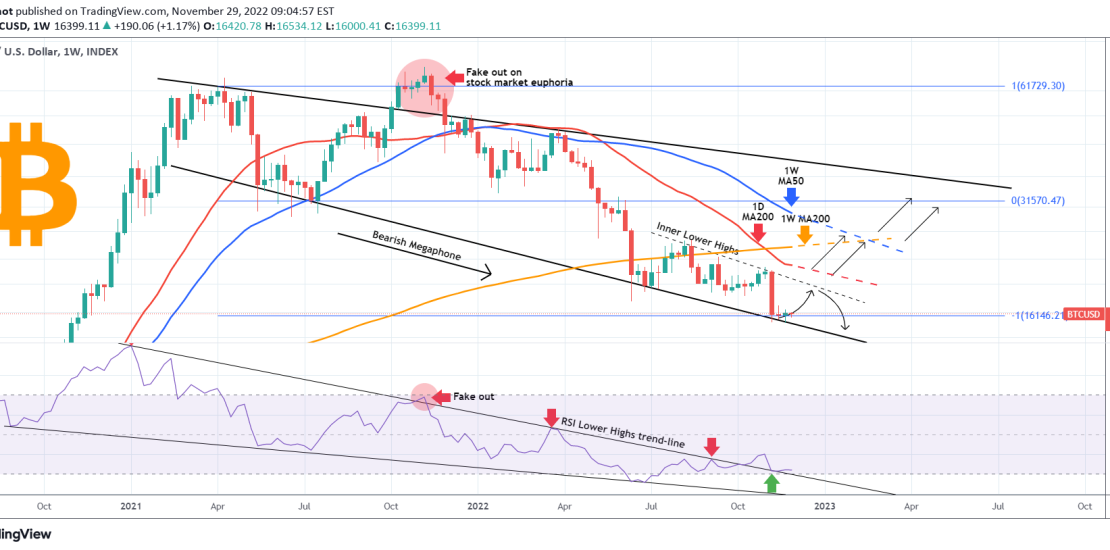
This is Bitcoin (BTCUSD) on the 1W (weekly) time-frame. The focus is on the Bearish Megaphone that has been running since the April 12 2021 High, drawn on the weekly candle bodies, ignoring the wicks. This is the pattern that has been dominating the whole Bear Cycle since its beginning, with the October –
-
DXY hit the 1D MA20 for the first time since June 2021!
- November 28, 2022
- Posted by: Tradingshot Articles
- Category: Forex
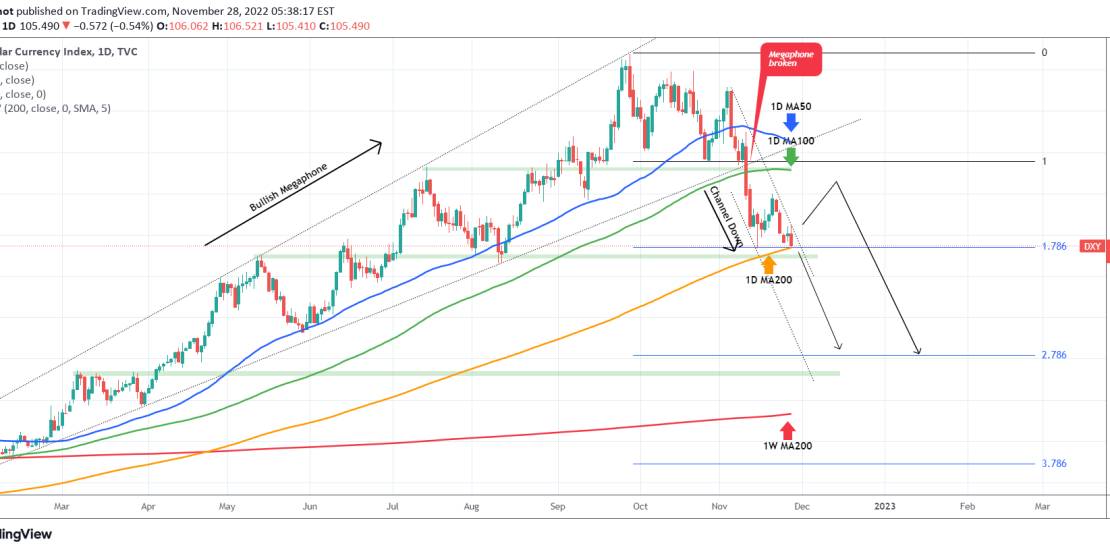
To be exact the last time the U.S. Dollar Index (DXY) hit its 1D MA200 (orange trend-line) was on June 23 2021 and last time it traded below it June 16 2021. Needless to say, this is a key development for the long-term price action, as a candle closing below it, confirms the transition
-
BITCOIN If this level holds, expect 50k on the next rally.
- November 25, 2022
- Posted by: Tradingshot Articles
- Category: Cryptocurrency
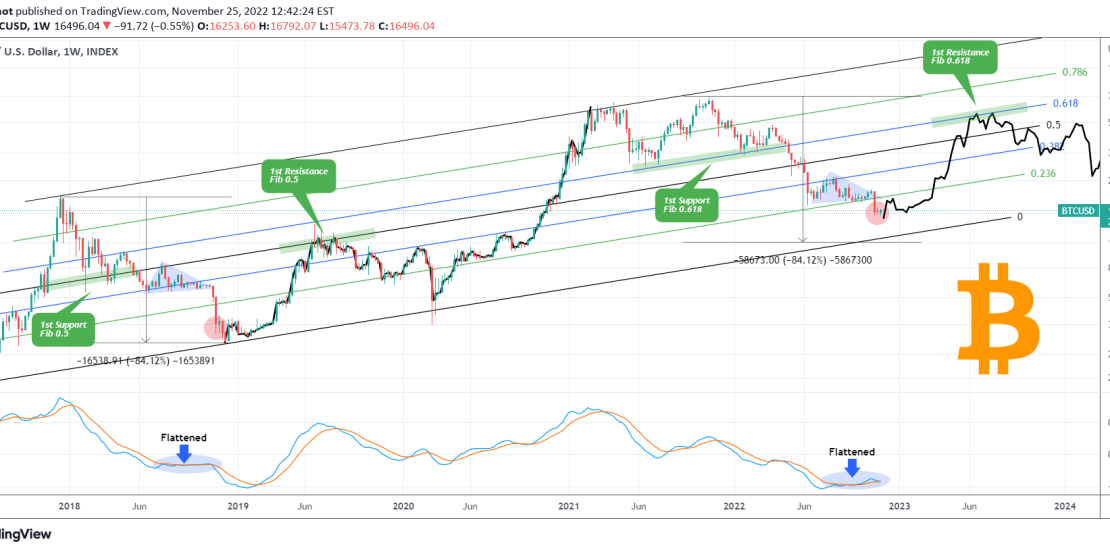
This is an interesting finding on the 1W time-frame, showing Bitcoin (BTCUSD) within a Channel Up since December 2017 High (of the previous Cycle). Below we analyze frame by frame the similarities and differences, key pressure levels and how those can make a projection for the following months. ** Triangle.. then flush ** A
-
DOW JONES doing what it has always done through history. Rising.
- November 25, 2022
- Posted by: Tradingshot Articles
- Category: Stock Indices
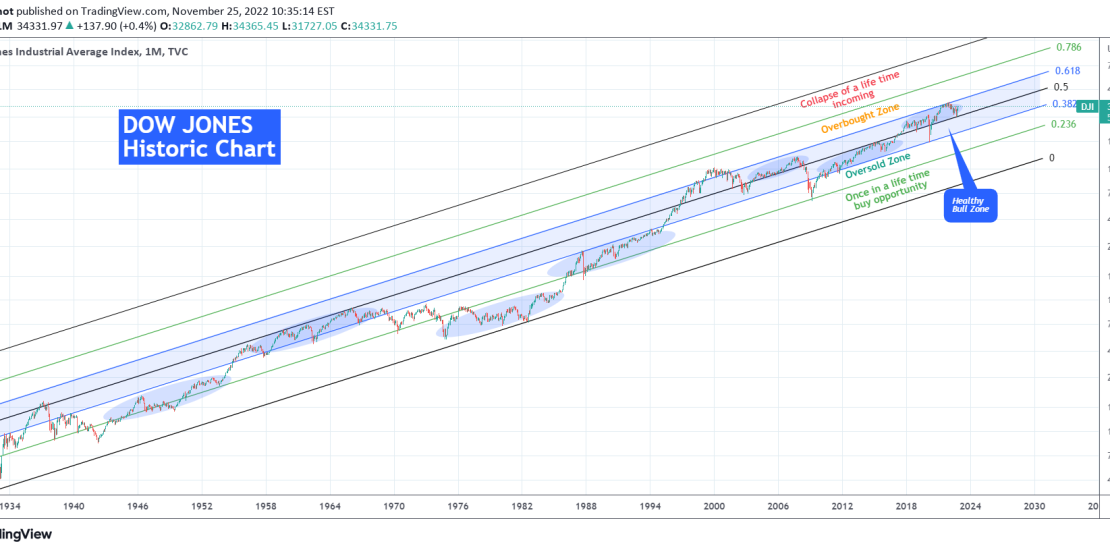
This is the Dow Jones Industrial Average Index (DJI) on the log scale since the great depression of the 1930s. A lot of talk is being done lately on whether or not this recent rally is sustainable, or if the high inflation can cause a deeper correction etc. In order to put things into
-
USDCNY Bearish below the 1D MA50
- November 24, 2022
- Posted by: Tradingshot Articles
- Category: Forex
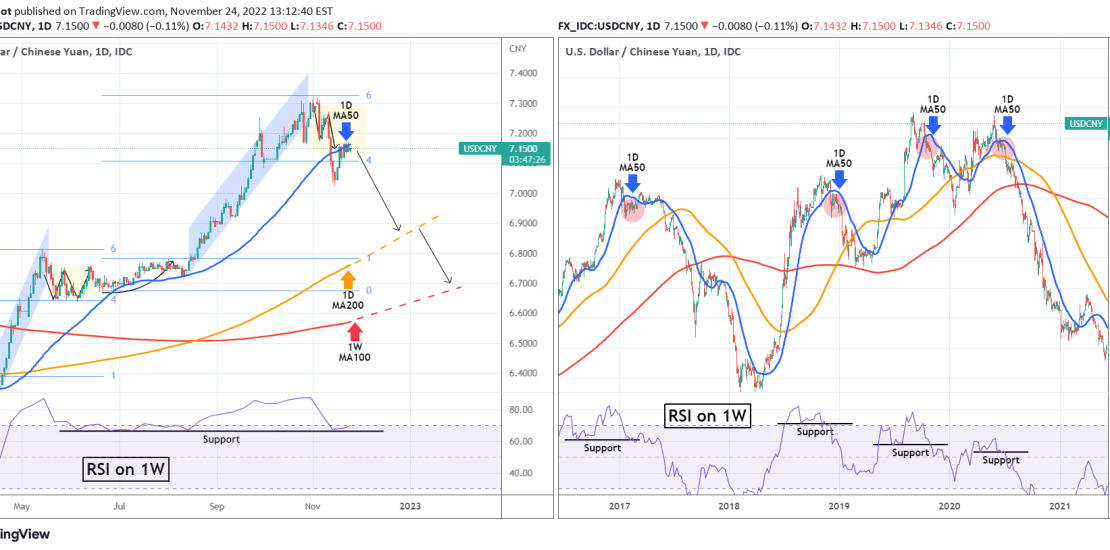
A month ago we called the top on the USDCNY: With the price breaking below Fibonacci 4.0, the pair has basically called for an extension of November’s downtrend. This will be confirmed if the price fails to close the week above the 1D MA50 (blue trend-line). As you see, on a sample dating back
-
NATURAL GAS Critical test for bullish or bearish December
- November 24, 2022
- Posted by: Tradingshot Articles
- Category: Commodities
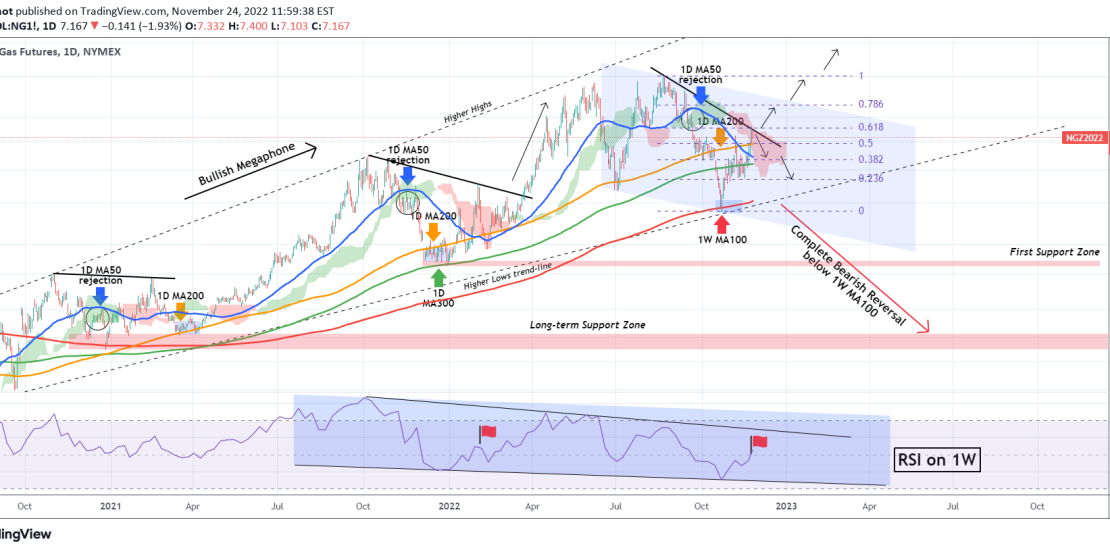
Natural Gas (NG1!) hit yesterday the Lower Highs trend-line of the August 22 top and today we see the first signs of a rejection. Until this breaks decisively, we can expect NG to pull-back to the 0.382 and 0.236 Fibonacci levels. Based on the 1W RSI though, which is on a Falling Wedge since
-
BERKSHIRE HATHAWAY repeating the post COVID recovery!
- November 23, 2022
- Posted by: Tradingshot Articles
- Category: Stocks
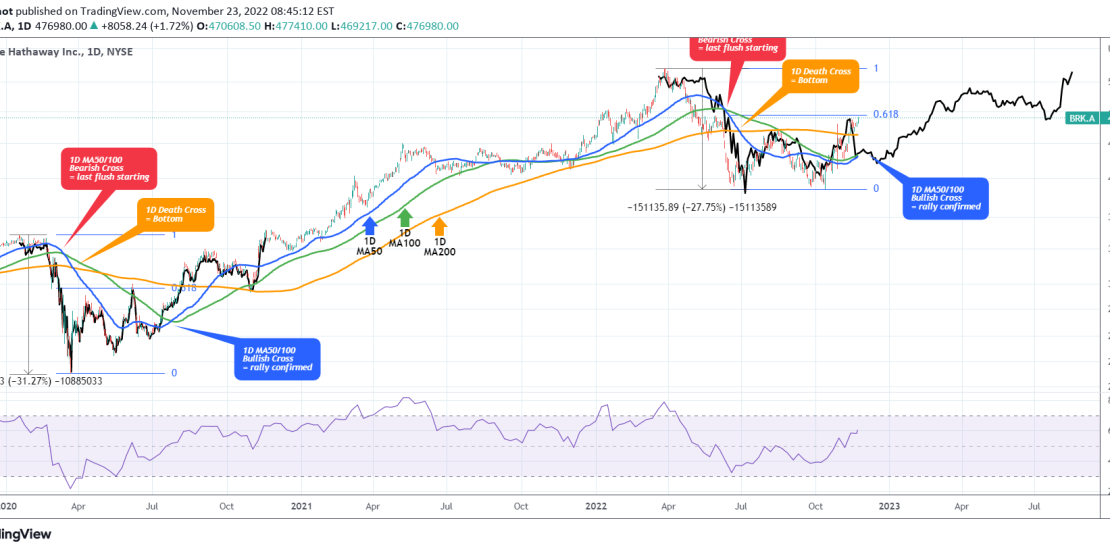
Berkshire Hathaway Inc. (BRK.A) made a new ~5 month High yesterday, spearheading the bullish reversal of high cap stocks at the moment. The price is above the 1D MA200 (orange trend-line) and well above the 1D MA100 (green trend-line) and 1D MA50 (blue trend-line), the latter two are about to make a Bullish Cross.

