

- November 23, 2022
- Posted by: Tradingshot Articles
- Category: Stocks
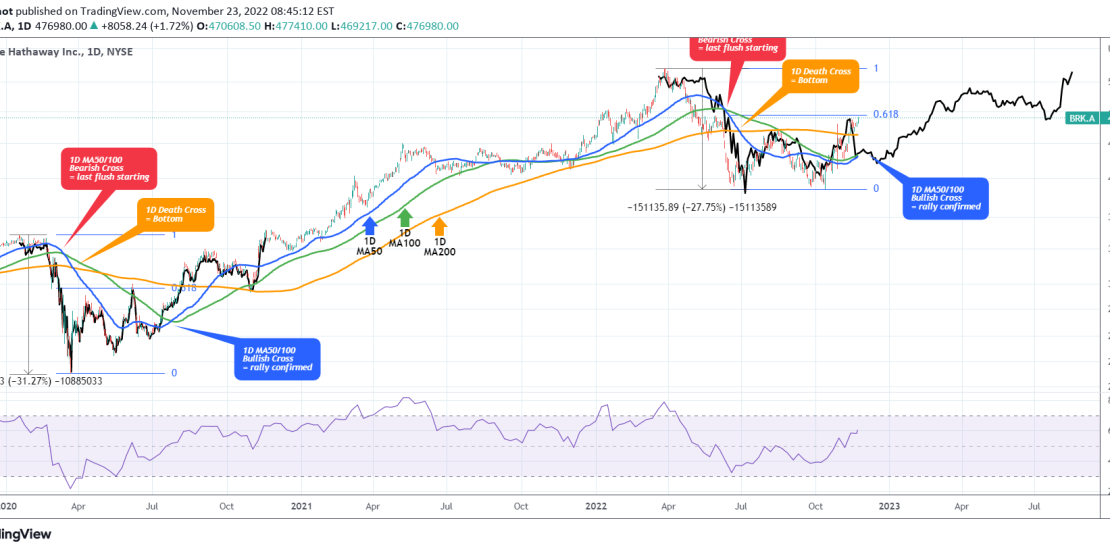
Berkshire Hathaway Inc. (BRK.A) made a new ~5 month High yesterday, spearheading the bullish reversal of high cap stocks at the moment. The price is above the 1D MA200 (orange trend-line) and well above the 1D MA100 (green trend-line) and 1D MA50 (blue trend-line), the latter two are about to make a Bullish Cross.
This draws comparisons with the previous ‘Strong correction’ Phase, during the COVID outbreak in February – March 2020. As you see the stock dropped a little over -30%, with the 1D MA50/100 Bearish Cross signaling the last flush, the 1D Death Cross signaling the Bottom and the 1D MA50/100 Bullish Cross the confirmation of the new rally.
This time during the 2022 correction phase, the stock dropped a little less than -30%, again the 1D MA50/100 Bearish Cross signaled the last flush, the 1D Death Cross signaled the Bottom and the 1D MA50/100 Bullish Cross is very close to take place. Will it confirm a new rally. That remains to be seen. What’s certain is the fact that this time, Berkshire is already above the 1D MA200, without having the 1D MA50/100 Bullish Cross, but it is just below the 0.618 Fibonacci retracement level, which was also a Resistance before the Cross.
We’ve plotted the 2020 correction and recovery phase on the 2022 price action (black line) and as you see, even though lengthened, it matches the trend almost perfectly. This points to a longer term recovery this time (reasonable in the absence of the 2020 trillions USD in rescue packages) but it does show an ATH test by Q3 2023.
Tradingview link: