

- November 24, 2022
- Posted by: Tradingshot Articles
- Category: Forex
A month ago we called the top on the USDCNY:

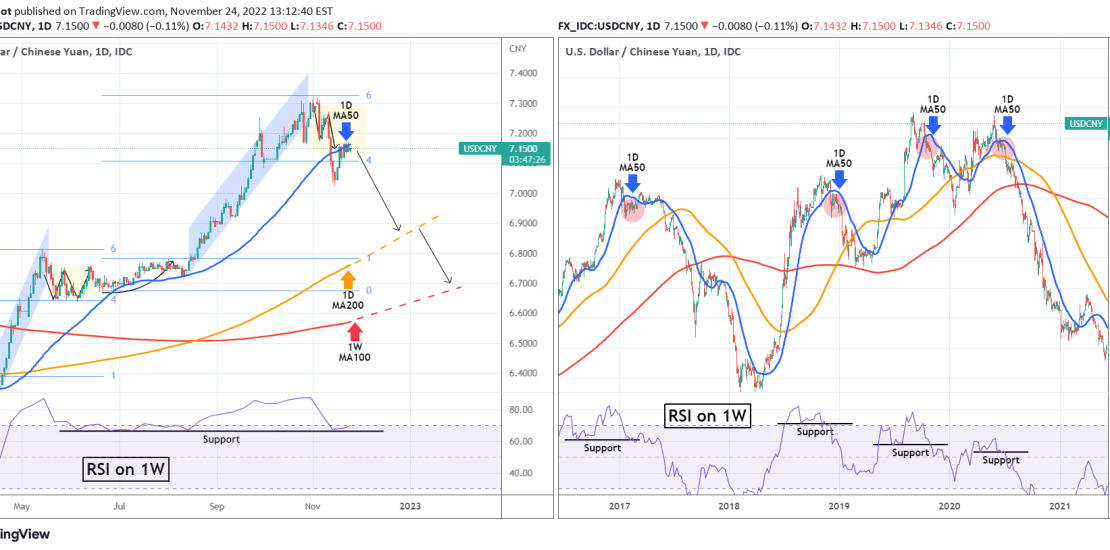
With the price breaking below Fibonacci 4.0, the pair has basically called for an extension of November’s downtrend. This will be confirmed if the price fails to close the week above the 1D MA50 (blue trend-line).
As you see, on a sample dating back to January 2017, every time the price failed to close above the 1D MA50 (four events), it extended its losses and broke below the 1D MA200 (orange trend-line), approaching the 1W MA100 (red trend-line) and on two occasions breaking (much) lower. A slightly different case is March 2017, when the price did break above the 1D MA50, but eventually collapsed below it a few weeks later.
Perhaps the best confirmation for a long-term sell would be when the RSI on the 1W time-frame breaks below its Support level. This happened on all of those cases since 2017.
As a result, we have a medium-term target for USDCNY on the 1D MA200.
Tradingview link:
https://www.tradingview.com/chart/USDCNY/3Uc2HAIN-USDCNY-Bearish-below-the-1D-MA50