

- November 25, 2022
- Posted by: Tradingshot Articles
- Category: Stock Indices
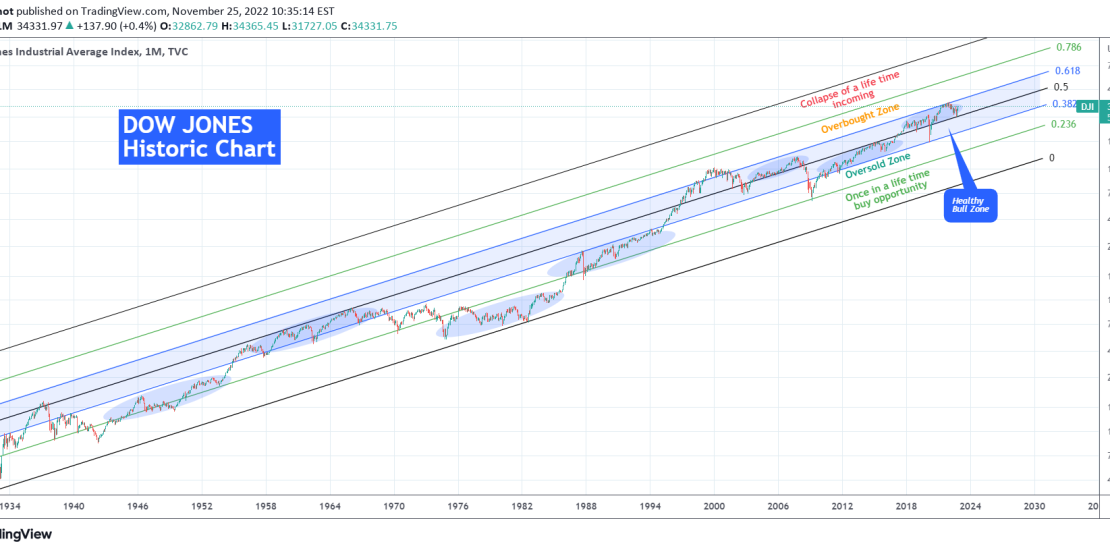
This is the Dow Jones Industrial Average Index (DJI) on the log scale since the great depression of the 1930s. A lot of talk is being done lately on whether or not this recent rally is sustainable, or if the high inflation can cause a deeper correction etc. In order to put things into perspective it is always useful to look into the longer term charts, preferably on a multi-year horizon.
This is on the 1M (monthly) time-frame where we’ve applied the Fibonacci Channel and its retracement levels on this 90 year price action. It is easy to realize that the Fibonacci levels have historically created zones of Support and Resistance. Right now, and despite the 2022 correction (Bear Market), Dow is within the 0.5 – 0.618 Fib, which is part of the larger 0.382 – 0.618 Fib Zone, which we call “Healthy Bull Zone” as when the index stays within it, it tends to rise on healthy growth levels.
To make things more interesting, Dow’s early January top (All Time High) and subsequent rejection was made exactly on the 0.618 Fib. It shouldn’t be a surprise that the recent October low and the subsequent rebound was made on the 0.5 Fib. This is a Support trend-line that 2017 only broke once during the 2020 COVID crash (which remarkably touched the 0.382 Fib and rebounded). In this 5 years Dow has been rising sustainably within this tight top half of the Healthy Bull Zone.
In fact, when the index trades within two levels tightly, it tends to do so for a very long time. Such periods are indicated by the blue ellipse patterns and besides the 2017 – 2022 one, we can see another 6 major periods.
As a result we can argue that right now Dow Jones is doing “what it always done through history” and that is rise sustainably within a tight Fibonacci zone long-term. This makes the index as bullish as it ever was.
Some added facts on this Channel. As you see we’ve categorized the zones based on the likely outcome they can provide. Next to the Healthy Bull Zone we see the Oversold (0.382 – 0.236 Fib) and Overbought (0.618 – 0.786 Fib) Zones, which is where the index presents a rare buy and sell opportunity respectively. In fact the 2008 Housing Crisis put us in an oversold position most recently and before that it was the 1987 Black Monday event. At the top of the Channel we have the 0.786 – 1.0 Fib ‘Collapse Zone’, where a mega collapse event is likely, and the index has only been there at the height of trading before the Great Depression. At the bottom of the Channel we have the 0.236 – 0.0 Fib ‘Once in a life time buy opportunity Zone’, which as you can imagine is the extremely oversold region where Dow has historically been the most attractive level to buy. The very bottom (March 2009) of the Housing Crisis marginally pierced through and before that (again marginally) the 1987 Black Monday.
** It is worth noting that from 1974 to 1986, the market traded almost entirely within this extremely oversold Fib zone. It was when the U.S. were ravaged by extremely high inflation levels (aftermath of the Vietnam war among others), with many sceptics today comparing the present day to that era.
Tradingview link: