

- November 29, 2022
- Posted by: Tradingshot Articles
- Category: Cryptocurrency
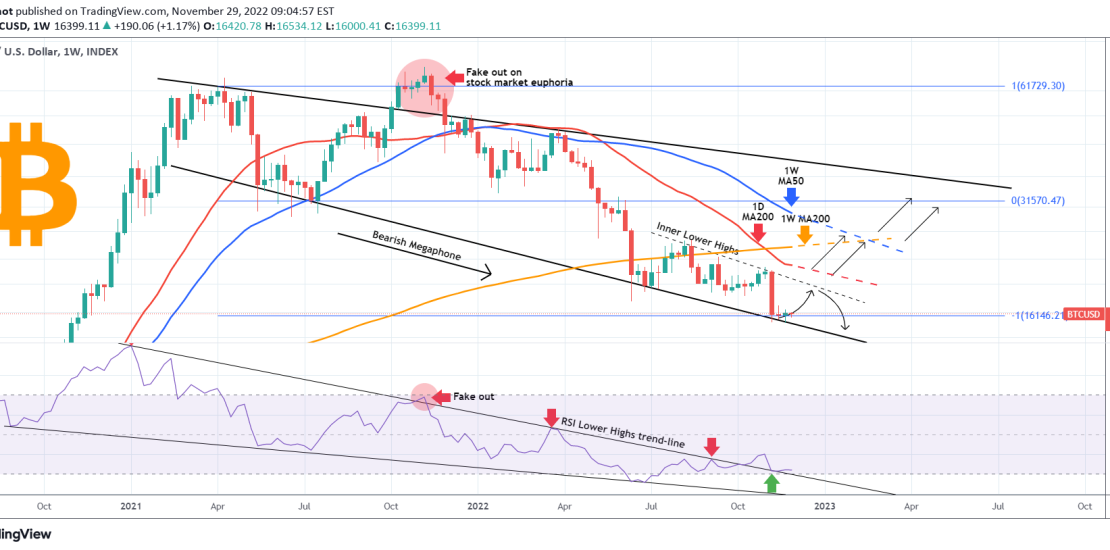
This is Bitcoin (BTCUSD) on the 1W (weekly) time-frame. The focus is on the Bearish Megaphone that has been running since the April 12 2021 High, drawn on the weekly candle bodies, ignoring the wicks. This is the pattern that has been dominating the whole Bear Cycle since its beginning, with the October – November fake-out rally excluded as its was the peak of a stock market euphoria at the end of the post COVID quantitative easing.
As you see, since the FTX crash (November 07 2022 candle), BTC is trading sideways on the 3rd straight flat week ranging within 15550 – 17150. At the same time, the 1W RSI hit the top (Lower Highs trend-line) of the Bear Cycle’s Falling Wedge, and has been rebounding. This could be an early indication that the long-term trend is shifting. On the short-term a potential rebound is limited to the Inner Lower Highs trend-line (dashed). The medium-term turns bullish only above the 1D MA200 (red trend-line), which has been intact for the whole year (since January 02 2022). If broken the medium-term targets are the 1W MA200 (orange trend-line) and 1W MA50 (blue trend-line).
On year-to-year basis, the target can be much higher. Look at how the current FTX Low was made on the -1.0 Fibonacci extension, counting from the first High and Low of the Bearish Megaphone. If the exact same symmetry plays out on the upside, then the 2.0 Fibonacci extension is located a little over $120000 (see chart below or narrow down the horizontal axis on the main chart).
Is this the start of a long-term bullish move for Bitcoin? Feel free to let me know in the comments section below!
Tradingview link: