

- November 28, 2022
- Posted by: Tradingshot Articles
- Category: Forex
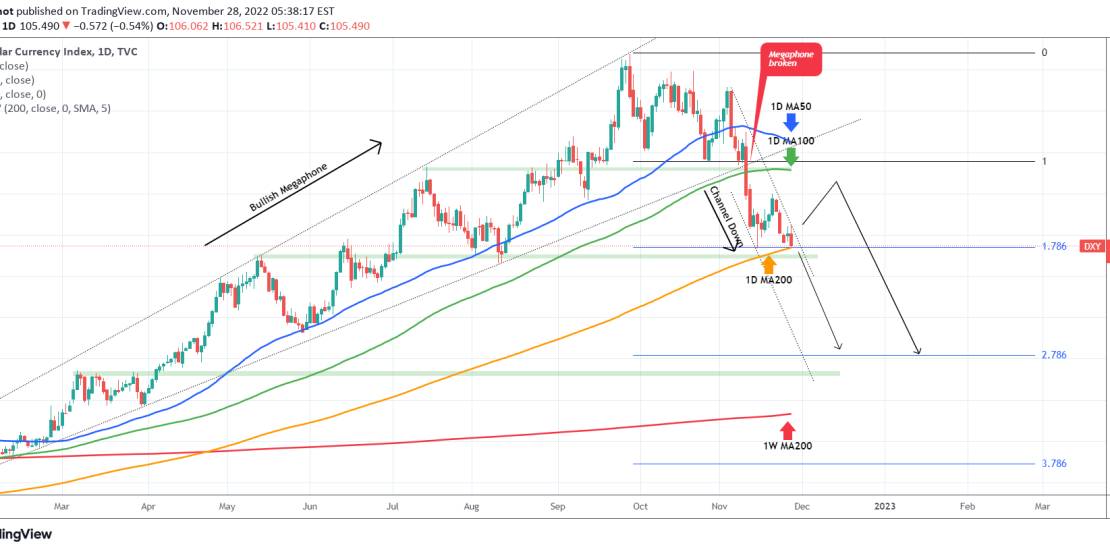
To be exact the last time the U.S. Dollar Index (DXY) hit its 1D MA200 (orange trend-line) was on June 23 2021 and last time it traded below it June 16 2021. Needless to say, this is a key development for the long-term price action, as a candle closing below it, confirms the transition from a long-term bearish trend to a bullish one.
So far since the November 03 High, the price seems to be trading within a very aggressive Channel Down. As long as it holds and 1D MA200 breaks, we expect a sharp fall to the 2.786 Fibonacci extension (100.200). If the price breaks above the Channel Down, we expect a counter trend rebound, short-lived, to the 1D MA100 (green trend-line) and the 1D MA50 (blue trend-line) to be tested as Resistance levels.
Tradingview link: