
-
DAX broke above the 1D MA100. Important Lower High test.
- August 12, 2022
- Posted by: Tradingshot Articles
- Category: Stock Indices
No Comments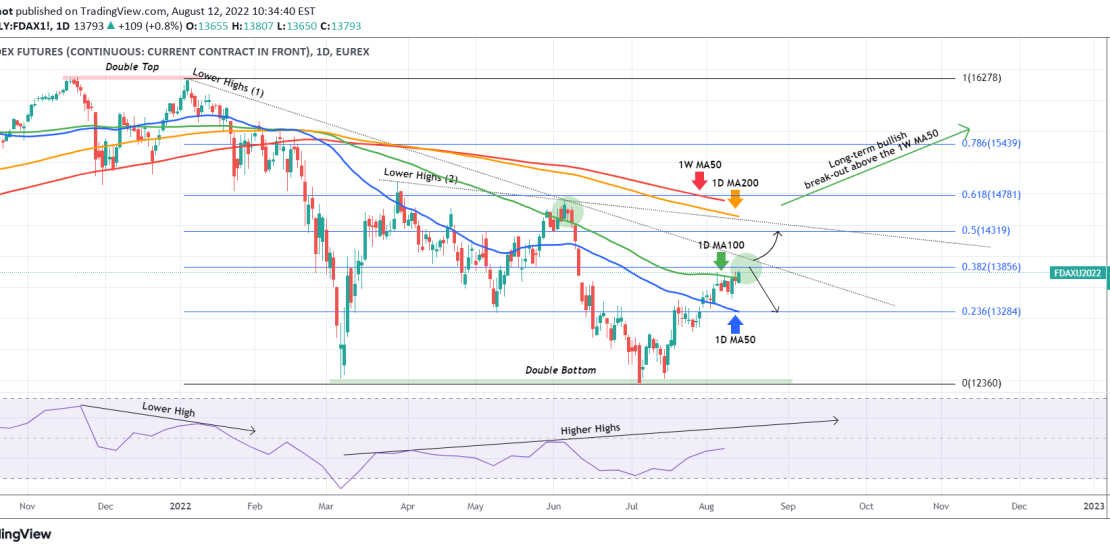
The German Index DAX (FDAX) is attempting today a 1D candle closing above the 1D MA100 (green trend-line) and if successful it will be the first since June 07. Despite the bullish short-term action, this is not the time to double down on buying as the January 05 Lower Highs trend-line (1) is right
-
NASDAQ testing the most important long-term Resistance cluster.
- August 11, 2022
- Posted by: Tradingshot Articles
- Category: Stock Indices
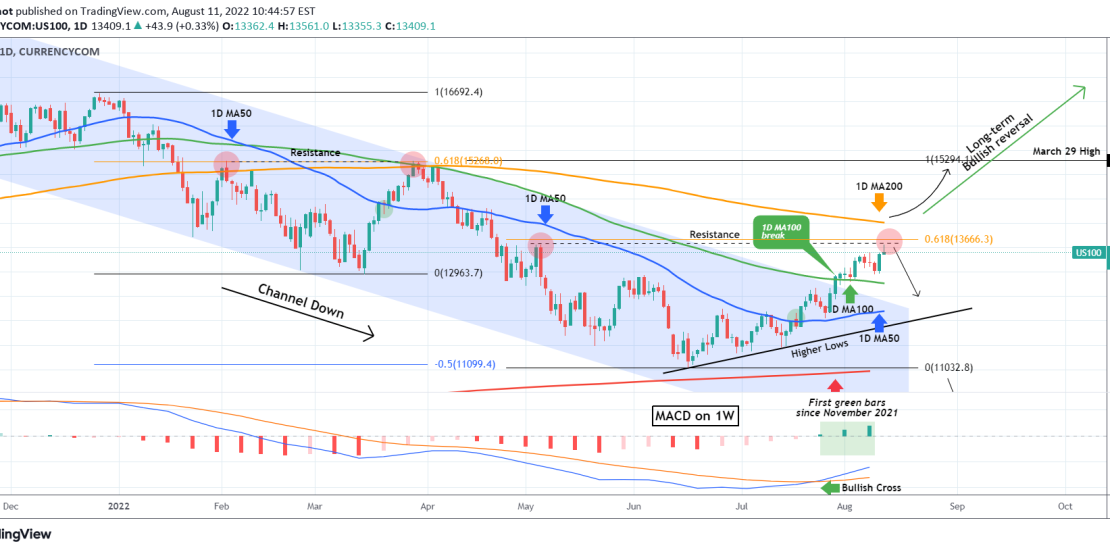
This is an update to last week’s analysis as Nasdaq (NDX) is finally putting the long-term Resistance cluster to test. That consists of the May 05 High (13600), the 0.618 Fibonacci retracement level (13666) and the 1D MA200 (orange trend-line), which has been intact since April 05. Basically the whole Lower Low – Lower
-
S&P500 Holding the Lower Bollinger. Not in a Bear Market yet.
- July 20, 2022
- Posted by: Tradingshot Articles
- Category: Stock Indices
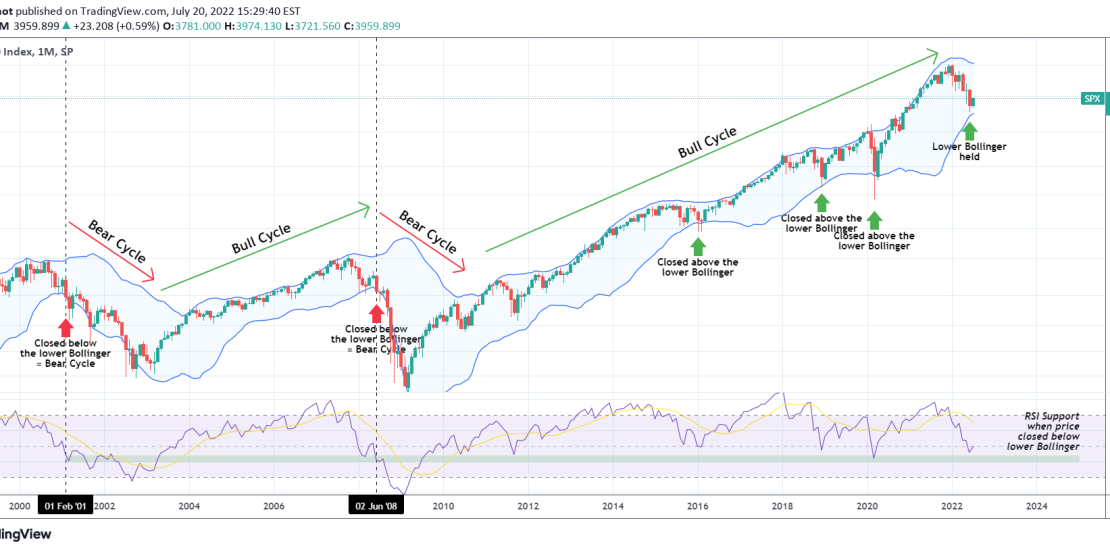
This is a simple S&P500 (SPX) analysis on the 1M (monthly) time-frame showing the Bollinger Bands and RSi indicators. Last month the price approached the Lower Bollinger Band to the closest level since April 2020. It held and July has so far been a strong green candle. As you see, we’ve had monthly breaks
-
DOW JONES attempting a 1D MA50 break-out
- July 8, 2022
- Posted by: Tradingshot Articles
- Category: Stock Indices
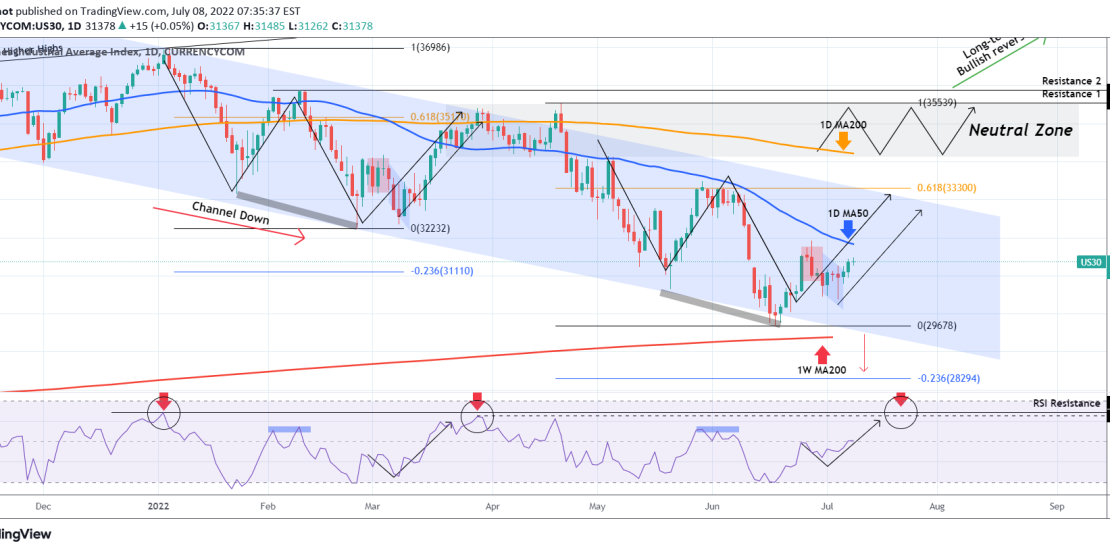
Dow Jones (DJI) reversed last week’s pull-back and is on a nearly perfect repeat of the last rebound to the top of the long-term Channel Down in an attempt to price a new Lower High. As most recently mentioned 3 weeks ago on our idea below, the Channel had already formed its short-term bottom:
-
S&P500 about to test the 1D MA50 for 1st time since April
- July 8, 2022
- Posted by: Tradingshot Articles
- Category: Stock Indices

The S&P500 index (SPX) has completed three straight green 1D candles and is approaching the 1D MA50 (blue trend-line) for a test that would be its first since April 21. This idea is basically a continuation of out analysis posted two weeks ago, exactly at the bottom (Lower Low) of the Channel Down: With
-
DOW JONES rejected before the 1D MA50. Double Bottom possible.
- June 29, 2022
- Posted by: Tradingshot Articles
- Category: Stock Indices
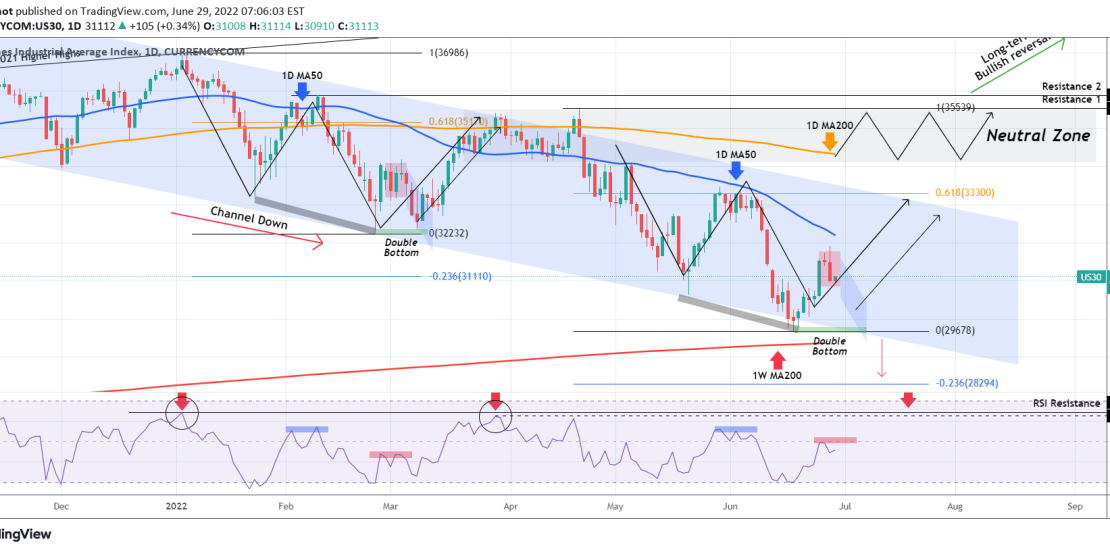
The Dow Jones index (DJI) has had a strong red 1D candle yesterday right before attempting a test of the 1D MA50 (blue trend-line), which is the short-term Resistance. As you see the long-term pattern has been a Channel Down since the January 05 high. This formation has enabled us to accurately identify and
-
S&P500 1D MA50 ahead. Careful about this Double Bottom scenario.
- June 27, 2022
- Posted by: Tradingshot Articles
- Category: Stock Indices
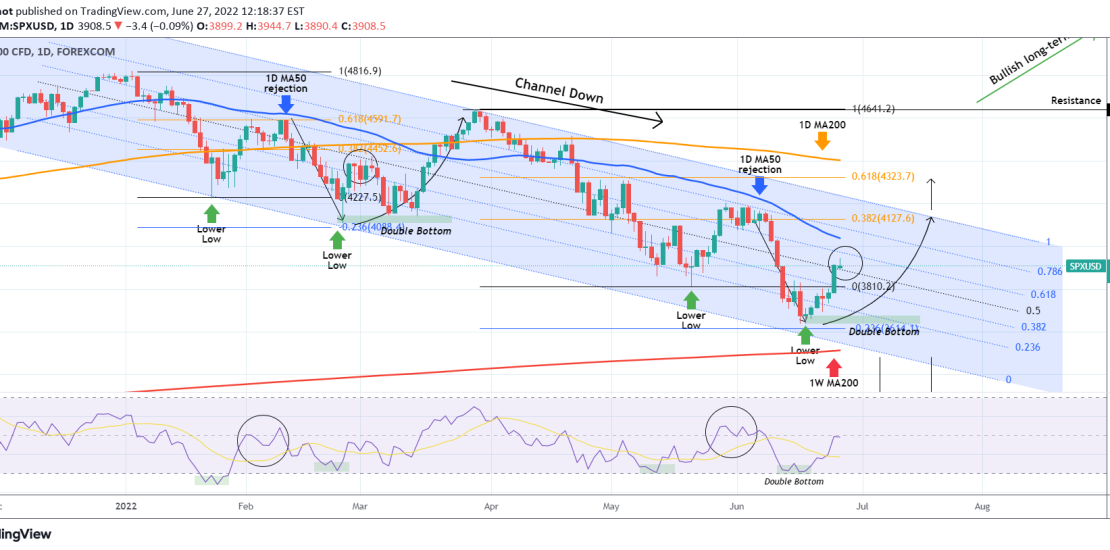
As with the other stock indices, we have certain type of patterns for S&P500 that help us identify medium/ long-term trends and take low risk/ high return positions on the market. In this case, it has been the Channel Down on the 1D time-frame since the January 04 All Time High that has given
-
S&P500 Bullish month ahead towards at least the 1D MA50
- June 20, 2022
- Posted by: Tradingshot Articles
- Category: Stock Indices
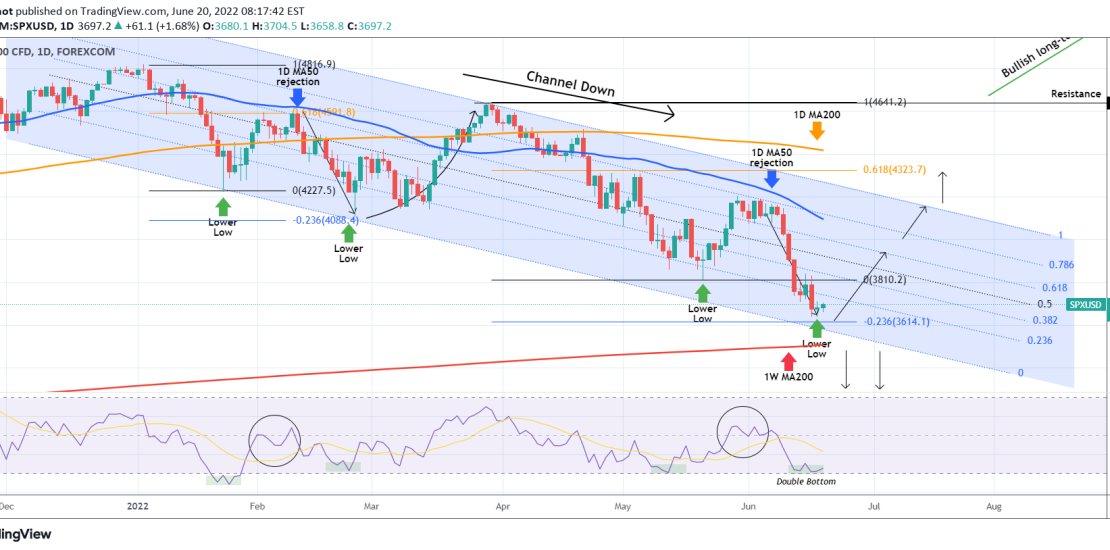
The S&P500 index continues to trade within a long-term Channel Down, providing excellent trade opportunities on its Lower Highs and Lower Lows. Our previous analysis on this symbol was a sell warning as the 1D MA50 (blue trend-line) was resisting: As it turned out, that was the most optimal sell of this phase and
-
DOW JONES Critical Channel bottom test.
- June 16, 2022
- Posted by: Tradingshot Articles
- Category: Stock Indices
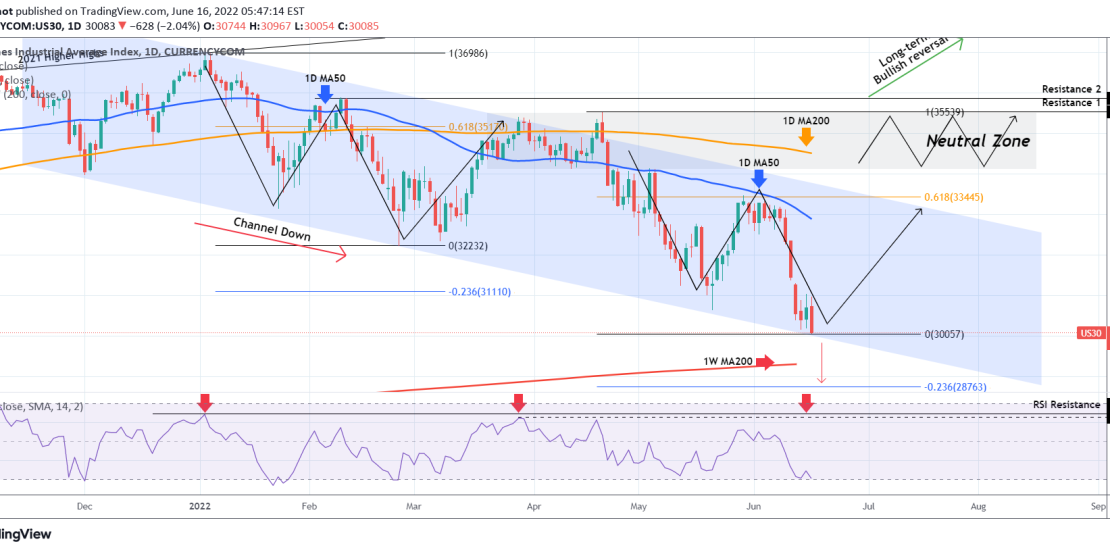
Dow Jones (DJI) has been trading within a Channel Down since its All Time High on January 04 2022. It is the very same Channel on which we based the accurate sell call 10 days ago as the price failed to break above the 1D MA50 (blue trend-line) for more than a week: Right
-
NASDAQ preparing a mid-March rebound with eyes on the 1W MA200
- June 16, 2022
- Posted by: Tradingshot Articles
- Category: Stock Indices
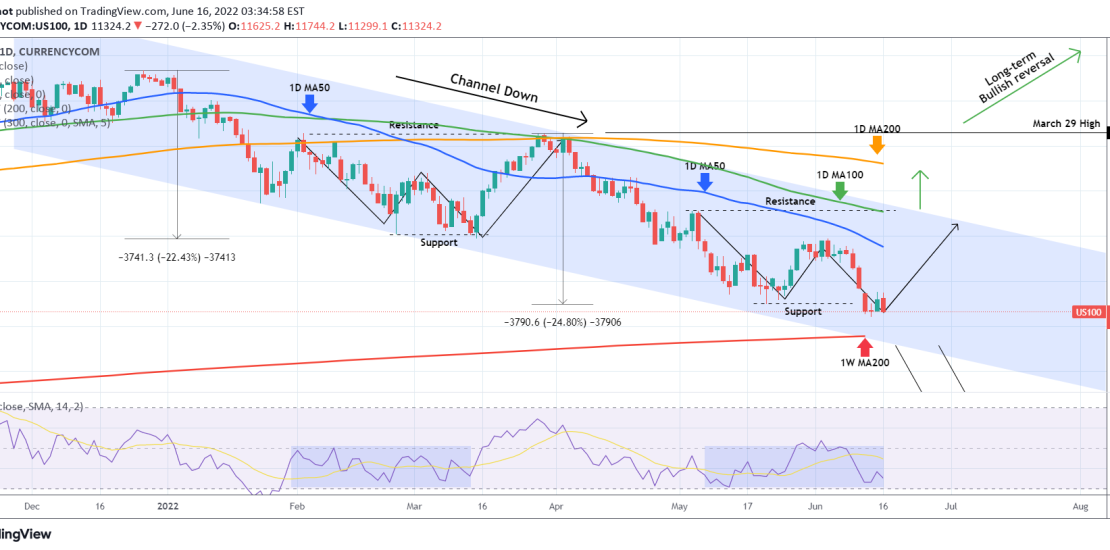
Our last analysis on Nasdaq (NDX) 10 days ago, came with a warning that as long as the 1D MA100 (green trend-line) and the Lower Highs trend-line of the long-term Channel Down held, the trend was bearish towards the 11500 Support: As you see the 11500 target was eventually hit, and with the Fed
