

- June 29, 2022
- Posted by: Tradingshot Articles
- Category: Stock Indices
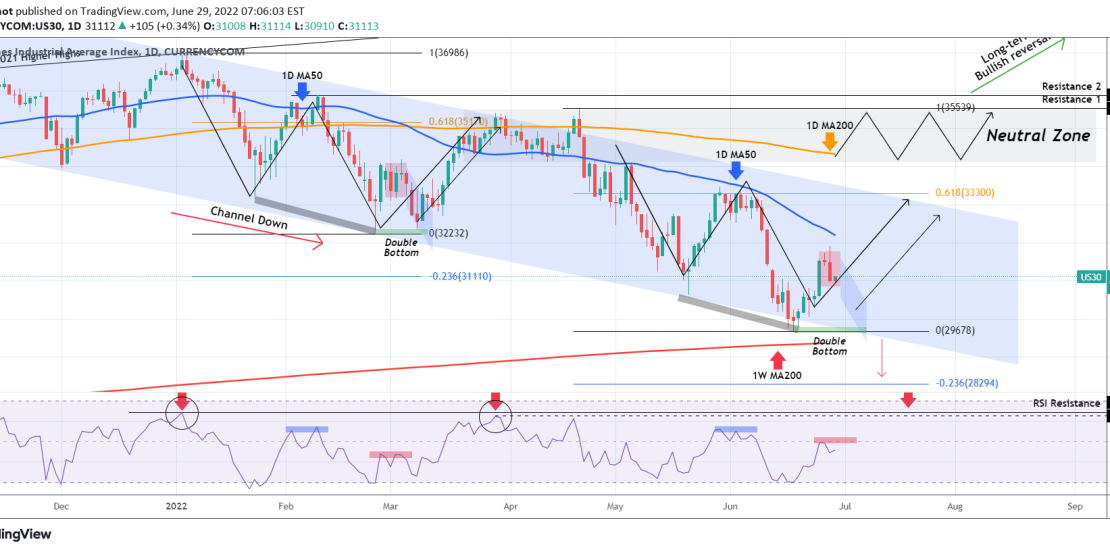
The Dow Jones index (DJI) has had a strong red 1D candle yesterday right before attempting a test of the 1D MA50 (blue trend-line), which is the short-term Resistance. As you see the long-term pattern has been a Channel Down since the January 05 high. This formation has enabled us to accurately identify and trade the Highs and Lows as you can see from the two most recent analyses below:


With some adjustments made, we can now see just how closely the recent short-term rebound follows the previous Lower Low formation on February 24. That sequence had a rejection before a 1D MA50 test and eventually made a Double Bottom before the rally to the Lower Highs (top) trend-line of the Channel Down started. As a result it is possible to see this 1 week correction stop near 29680 and then rebound towards the 0.618 Fibonacci retracement level.
The 1W MA200 (red trend-line) is right below the Channel Down and as we’ve mentioned numerous times on our Channel is the long-term market Support. Breach of that level with a weekly candle closing should immediately test the -0.236 Fib extension and then pursue lower targets on the weekly from there. If that happens we’ll follow up with extensive updates.
Tradingview link: