

- July 8, 2022
- Posted by: Tradingshot Articles
- Category: Stock Indices
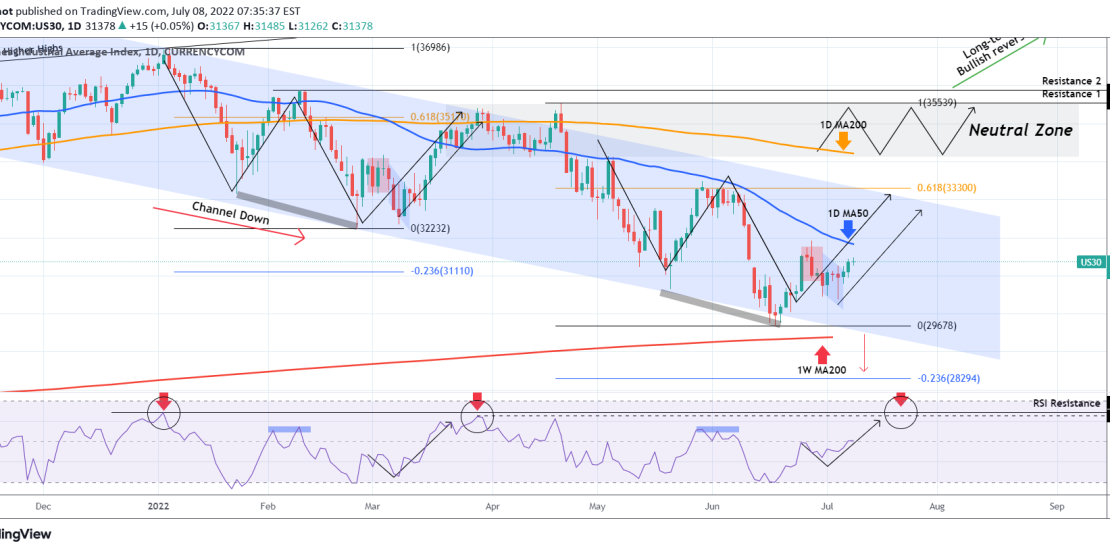
Dow Jones (DJI) reversed last week’s pull-back and is on a nearly perfect repeat of the last rebound to the top of the long-term Channel Down in an attempt to price a new Lower High. As most recently mentioned 3 weeks ago on our idea below, the Channel had already formed its short-term bottom:

At the moment, based also on the 1D RSI fractals, it appears that we’ll break the 1D MA50 and aim for at least 32800 as a Lower High with a more optimistic estimate on the 0.618 Fibonacci retracement level (33300).
The 1W MA200 (red trend-line) is right below the Channel Down and as we’ve mentioned numerous times on our Channel is the long-term market Support. Breach of that level with a weekly candle closing should immediately test the -0.236 Fib extension and then pursue lower targets on the weekly from there. If that happens we’ll follow up with extensive updates.
Tradingview link:
https://www.tradingview.com/chart/US30/Q6jVSSIK-DOW-JONES-attempting-a-1D-MA50-break-out