

- June 20, 2022
- Posted by: Tradingshot Articles
- Category: Stock Indices
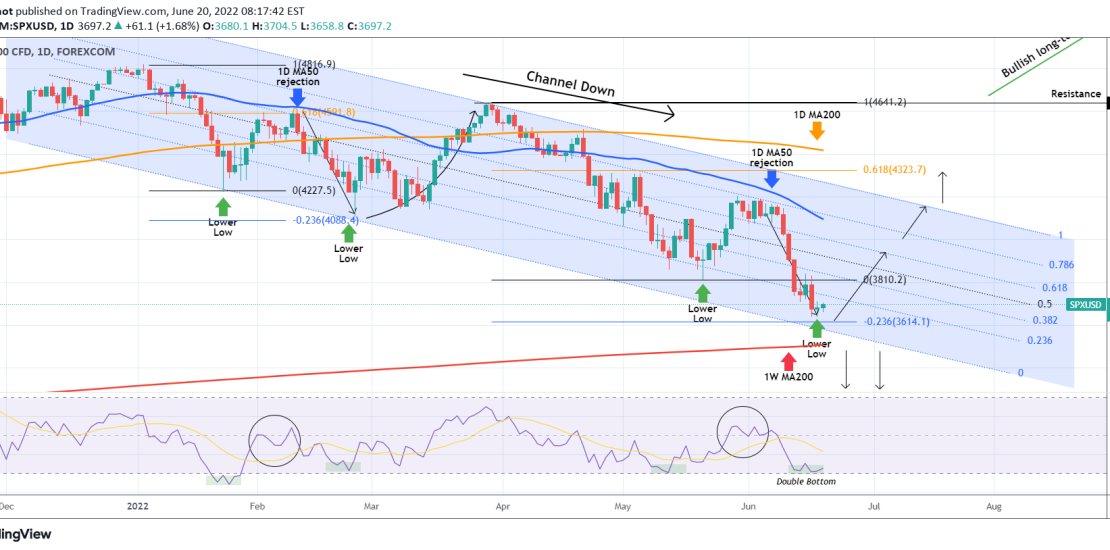
The S&P500 index continues to trade within a long-term Channel Down, providing excellent trade opportunities on its Lower Highs and Lower Lows. Our previous analysis on this symbol was a sell warning as the 1D MA50 (blue trend-line) was resisting:

As it turned out, that was the most optimal sell of this phase and the index confirmed our trading plan by making a new Lower Low on the Channel. Being just shy off the -0.236 Fibonacci extension, we expect the index to reverse now and rebound on a 1 month horizon. This is further backed by the 1D RSI Double Bottom on the oversold barrier. That continues to mirror the Lower Lows sequence of late January – February 2022, which initiated a rebound towards the Lower Highs (top) trend-line of the Channel Down, above both the 1D MA50 and the 1D MA200 (orange trend-line).
That Lower High was priced on the 0.618 Fibonacci retracement level from the previous Lower Low. That level is now around 4323, which is above the Channel Down, so a more modest target set would be first the 1D MA50, which at the time should be around 3950 and with a candle closing above it, an extension target near the top (Lower Highs) of the Channel, around 4100.
The invalidation of this pattern will come only with a weekly closing below the 1W MA200 (red trend-line), in which case we may see a rapid sell-off towards the 1M MA100.
Tradingview link: