

- June 16, 2022
- Posted by: Tradingshot Articles
- Category: Stock Indices
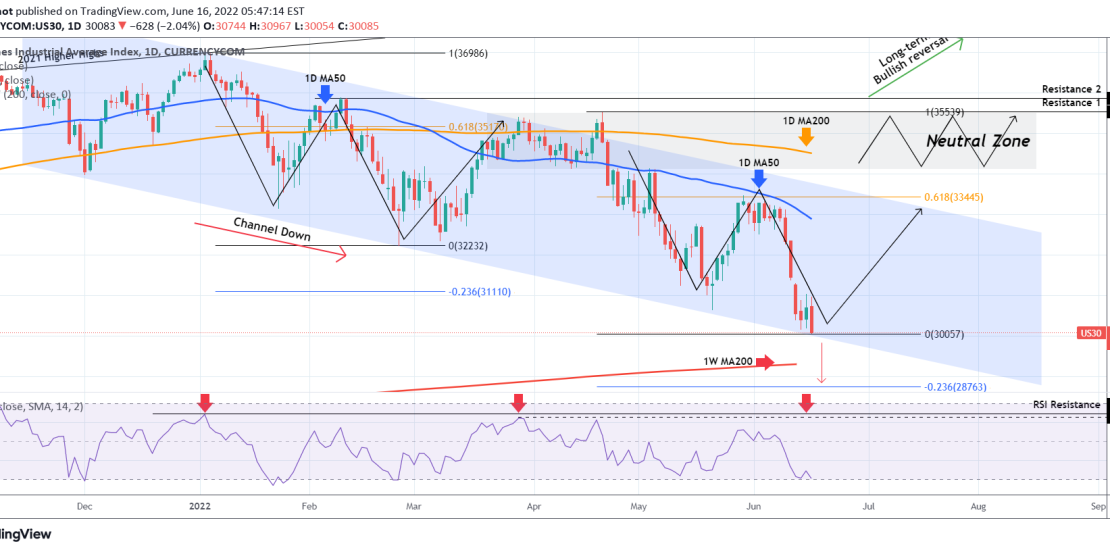
Dow Jones (DJI) has been trading within a Channel Down since its All Time High on January 04 2022. It is the very same Channel on which we based the accurate sell call 10 days ago as the price failed to break above the 1D MA50 (blue trend-line) for more than a week:

Right now the index broke below the previous Support and made a new Low. In fact it is exactly on the Lower Lows trend-line of the Channel. The 1W MA200 (red trend-line) is at 29300 but if it closes a 1D candle below the Lower Lows trend-line, it will most likely break below the 1W MA200 as well and reach the -0.236 Fibonacci extension around 28770.
Until that happens, we have to follow the accurate long-term pattern and go on a tight SL buy towards the Lower Highs (top) trend-line around 33000. The 1D RSI is just above the oversol 30.00 level which has worked as a buy entry for many months.
Tradingview link:
https://www.tradingview.com/chart/US30/DOyxoOkC-DOW-JONES-Critical-Channel-bottom-test