

- August 11, 2022
- Posted by: Tradingshot Articles
- Category: Stock Indices
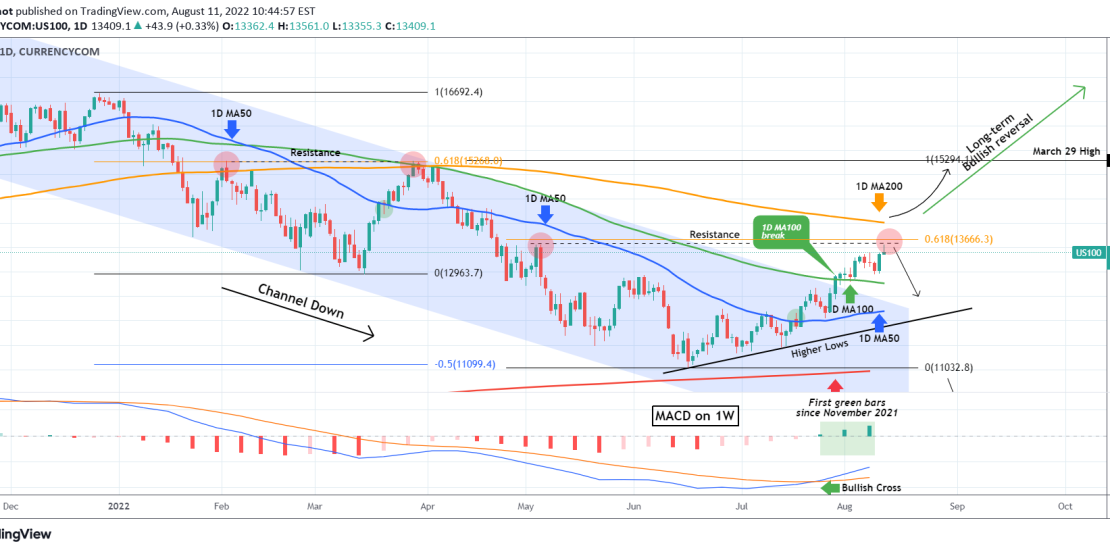
This is an update to last week’s analysis as Nasdaq (NDX) is finally putting the long-term Resistance cluster to test. That consists of the May 05 High (13600), the 0.618 Fibonacci retracement level (13666) and the 1D MA200 (orange trend-line), which has been intact since April 05.
Basically the whole Lower Low – Lower High leg within the 8 month Channel Down, has been symmetrical to that of December 28 2021 – March 30 2022. It was again that same (analogous) Resistance cluster that rejected the index, formed the Lower High and initiated the next selling leg to a Lower Low. As you see on the chart, the price got rejected exactly on the 0.618 Fib/ Resistance level.
As a result we have a very low risk sell trade here, targeting the 1D MA50 (blue trend-line). A 1W candle close above the 1D MA200 would constitute a bullish break-out and a trend shift on the long-term from bearish to bullish with a first target the 15300 March 29 High. We have to note that with the 1W MACD on the first Bullish Cross since November 2021 and the histogram on the first green 1W bars since also November, the bullish case is getting stronger especially amidst the encouraging inflation data these past few days.
Tradingview link: