

- July 20, 2022
- Posted by: Tradingshot Articles
- Category: Stock Indices
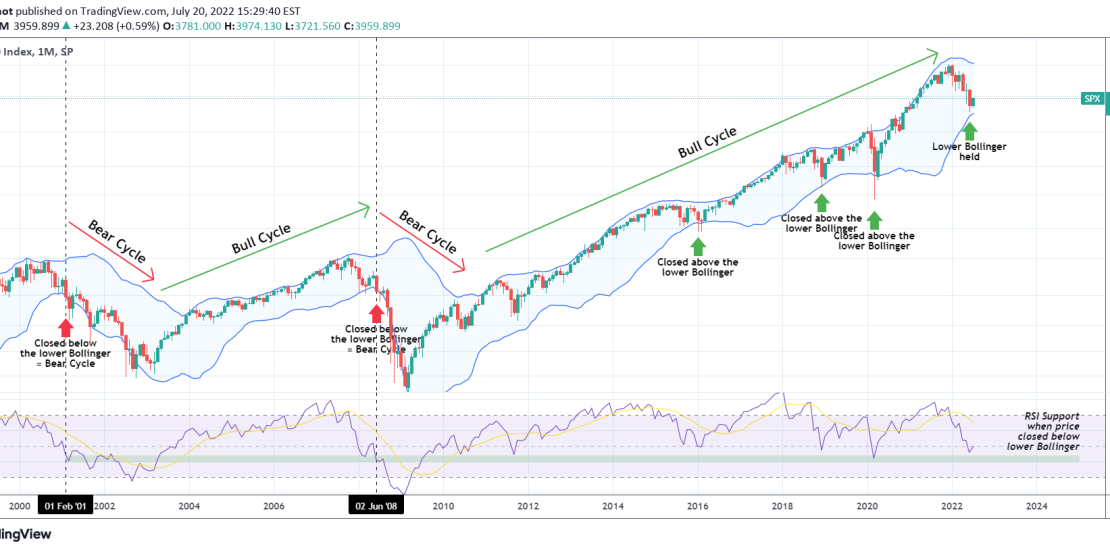
This is a simple S&P500 (SPX) analysis on the 1M (monthly) time-frame showing the Bollinger Bands and RSi indicators.
Last month the price approached the Lower Bollinger Band to the closest level since April 2020. It held and July has so far been a strong green candle. As you see, we’ve had monthly breaks of the Lower Bollinger but no candle closes below it, more specifically Jan-Feb 2016, Dec 2018 and March-April 2020. The market continued its long-term Bull Cycle to new market Highs each time.
In recent history, it was only when we had a montly candle closing below the Lower Bollinger (June 2008 and Feb 2001) that we got a confirmed break into a Bear Cycle. At the time of those closings, the 1M RSI was within 44.20 – 40.00. June almost hit that level but held and is seen rebounding.
Do you agree with this chart showing that we are not in a Bear Cycle yet?
Tradingview link: