
-
DOW JONES RSI and MACD patterns hint to a June-Aug like rebound.
- October 10, 2022
- Posted by: Tradingshot Articles
- Category: Stock Indices
No Comments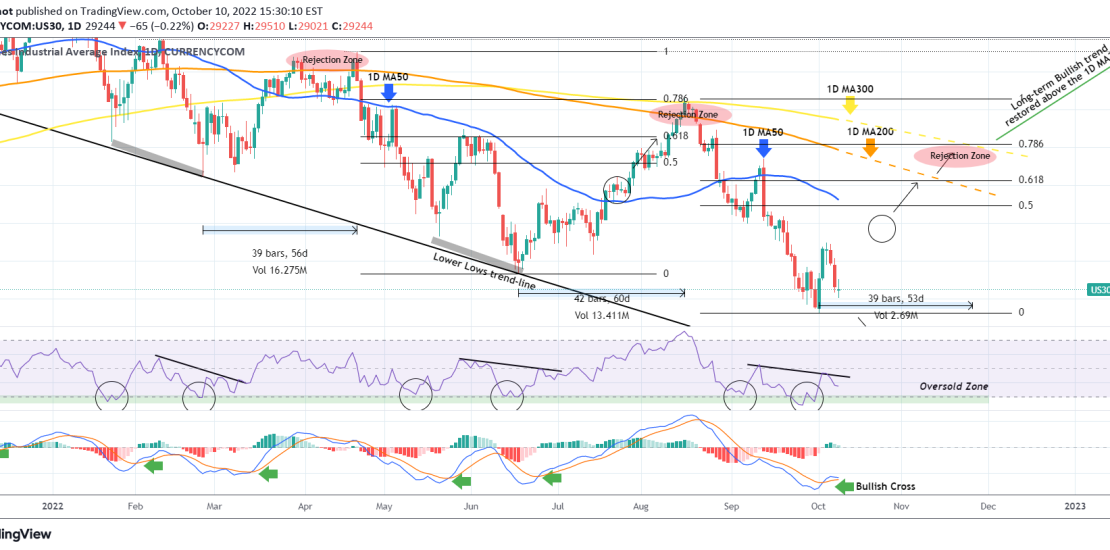
The Dow Jones Industrial Average (DJI) has been highly volatile today following a two day selling sequence on last week’s closing. Following the NFP on Friday, the market is entering the anticipation mode over this week’s CPI report, which is crucial on the Fed’s rate policy. Amidst this high volatility we have spotted a
-
DAX Broke the 4H MA50. Bearish extension.
- October 8, 2022
- Posted by: Tradingshot Articles
- Category: Stock Indices
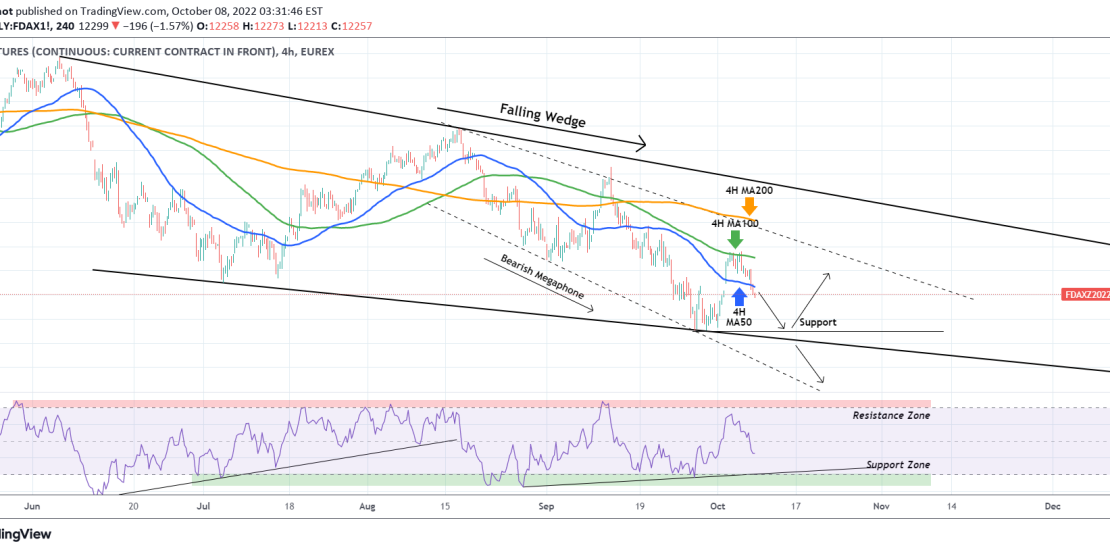
The German stock index (DAX) broke below its 4H MA50 (blue trend-line) on Friday after failed to break and being rejected on the 4H MA100 (green trend-line) earlier this week. This keeps the price inside both the short-term Bearish Megaphone pattern and the longer term Falling Wedge pattern. That break is a major sell
-
DOW JONES Oversold but that alone not enough for a buy
- September 27, 2022
- Posted by: Tradingshot Articles
- Category: Stock Indices
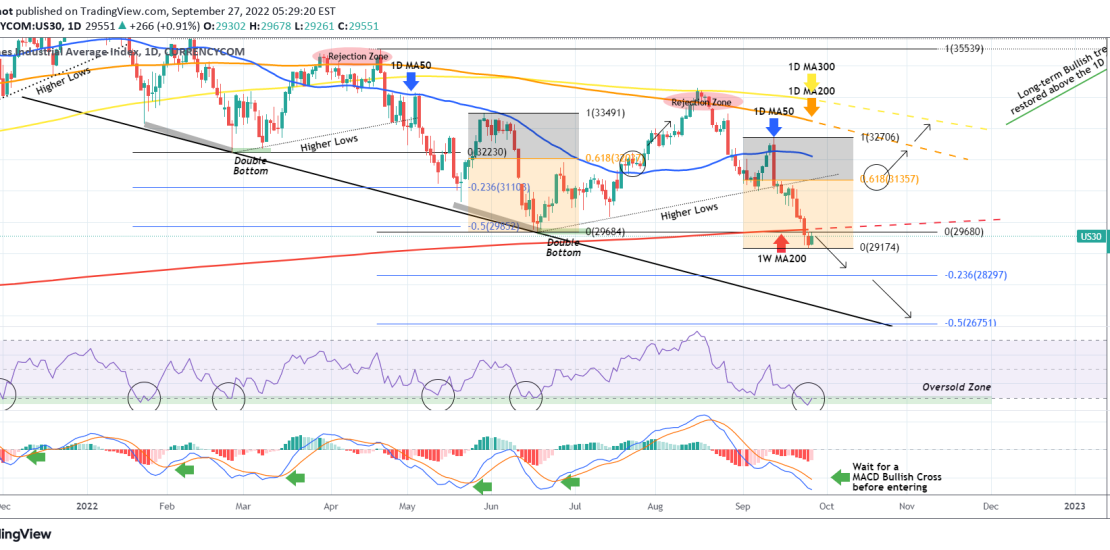
The Dow Jones Industrial Average (DJI)broke and closed last week below its 1W MA200 (red trend-line), for the first time since the week of May 11 2020, a very bearish sign on its own. Based on what the index did on May 09 2022 after breaking the previou Support (Double Bottom), the price now
-
S&P500 Is this the last Support standing??
- September 26, 2022
- Posted by: Tradingshot Articles
- Category: Stock Indices
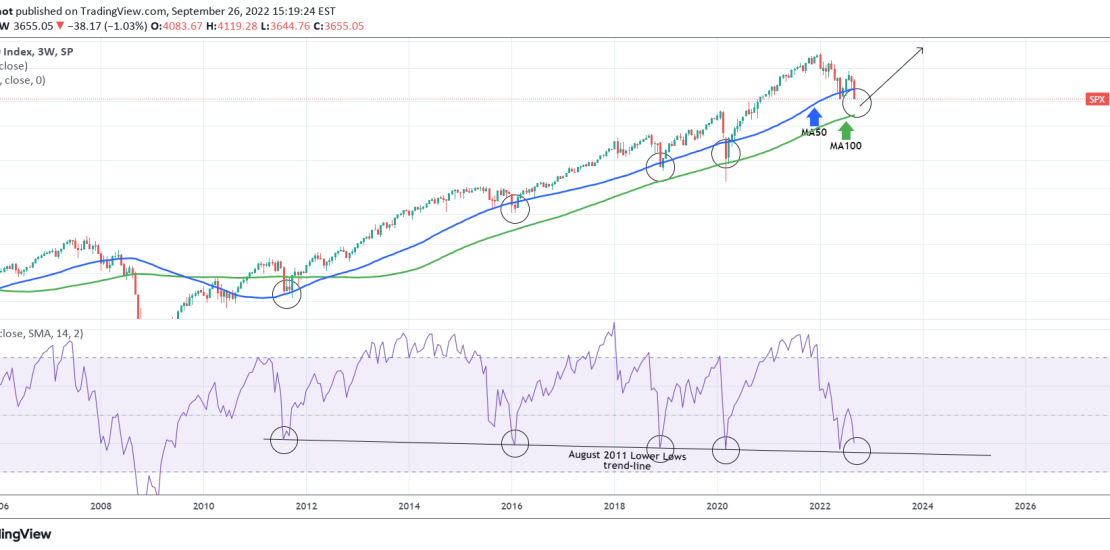
The S&P500 index (SPX) has been pulling back again considerably since the mid-August High, which still was a Lower High within the current Bear Phase. A very consistent pattern that throughout this prolonged, multi-year Bull Cycle has offered the best buy entries possible, can be seen on the 3W time-frame. The signal is given
-
DAX Lower bottom and recovery signal on 8-year pattern
- September 26, 2022
- Posted by: Tradingshot Articles
- Category: Stock Indices
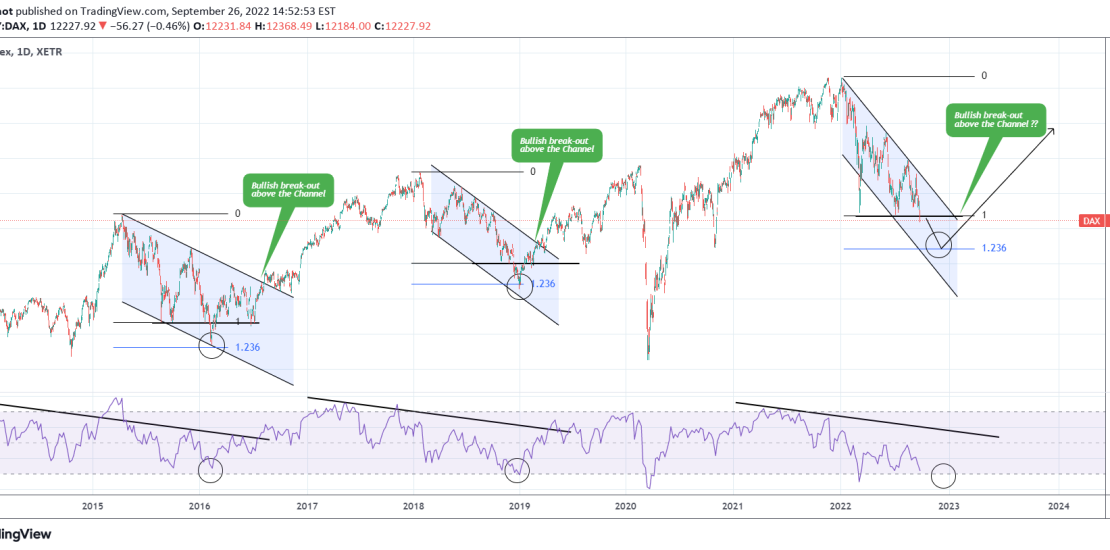
The German stock index (DAX) has been trading under Lower Highs ever since the late December All Time High (ATH). Ignoring the March 08 2022 breach due to the Ukraine – Russia war, the pattern is a Channel Down. The last two times DAX traded within a Channel Down was for the whole year
-
S&P500 How to trade it following the 0.75% Rate Hike
- September 22, 2022
- Posted by: Tradingshot Articles
- Category: Stock Indices
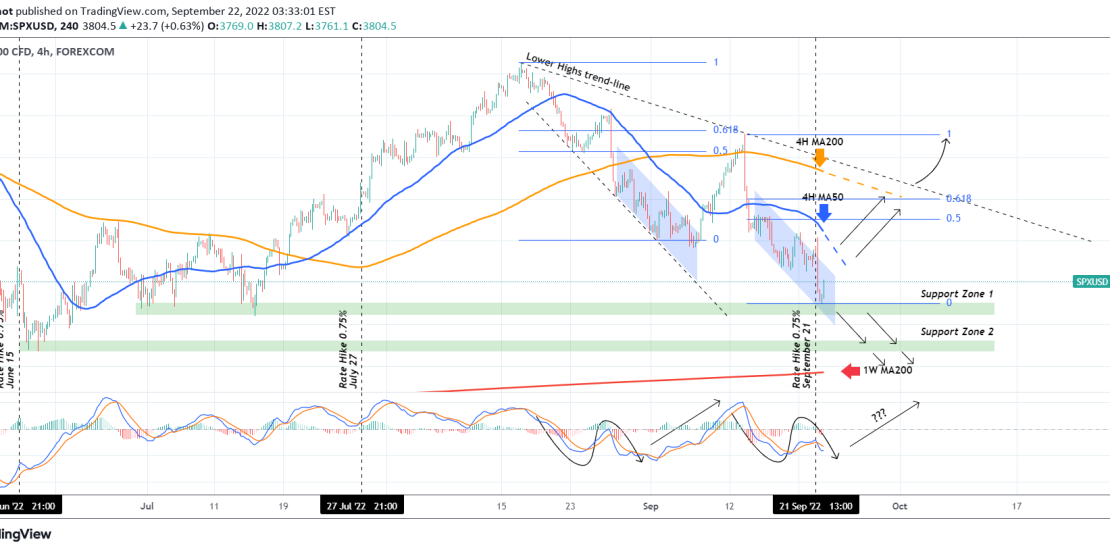
The S&P500 index (SPX) dipped aggressively following yesterday’s Fed Rate Decision, which was a natural reaction to the third straight 0.75% rate hike. The first one was made on Jun 15 2022 (rate gone from 1.00% up to 1.75%) and the second on July 27 2022 (rate gone from 1.75% to 2.50%). In both
-
S&P500 These market dynamics show we’re not in a Bear Market yet
- September 6, 2022
- Posted by: Tradingshot Articles
- Category: Stock Indices
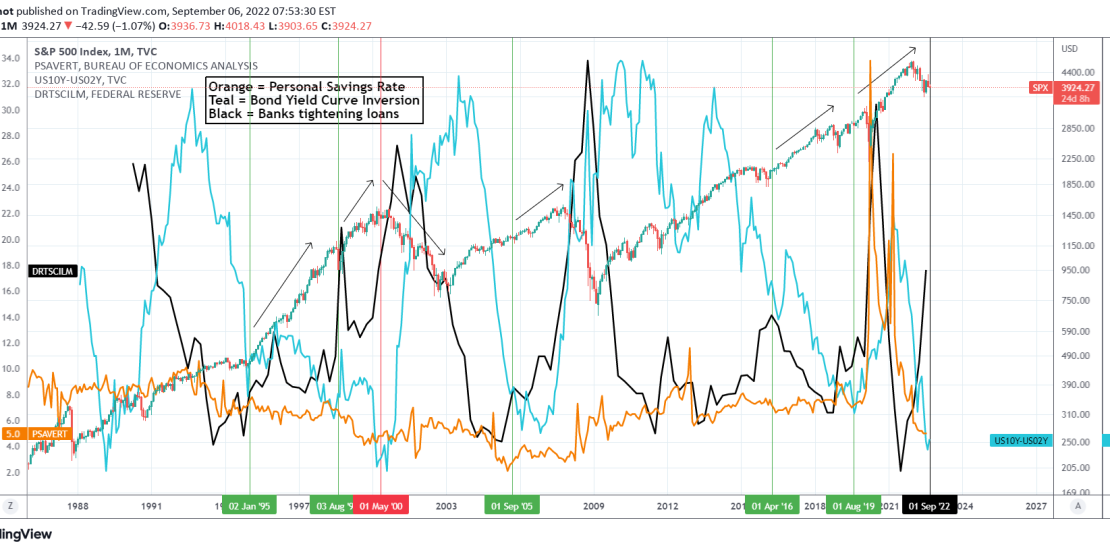
This is a cross asset technical analysis on the S&P500 Index (SPX) on the 1M (monthly) time-frame. The symbols included are the Personal Savings Rate (orange trend-line), the Yield Curve Inversion (teal trend-line) and the % of Domestic Banks tightening (black trend-line). ** Personal Savings ** A little background info on what each symbol
-
DOW JONES on the 2008 crash fractal and how it avoids it.
- September 2, 2022
- Posted by: Tradingshot Articles
- Category: Stock Indices
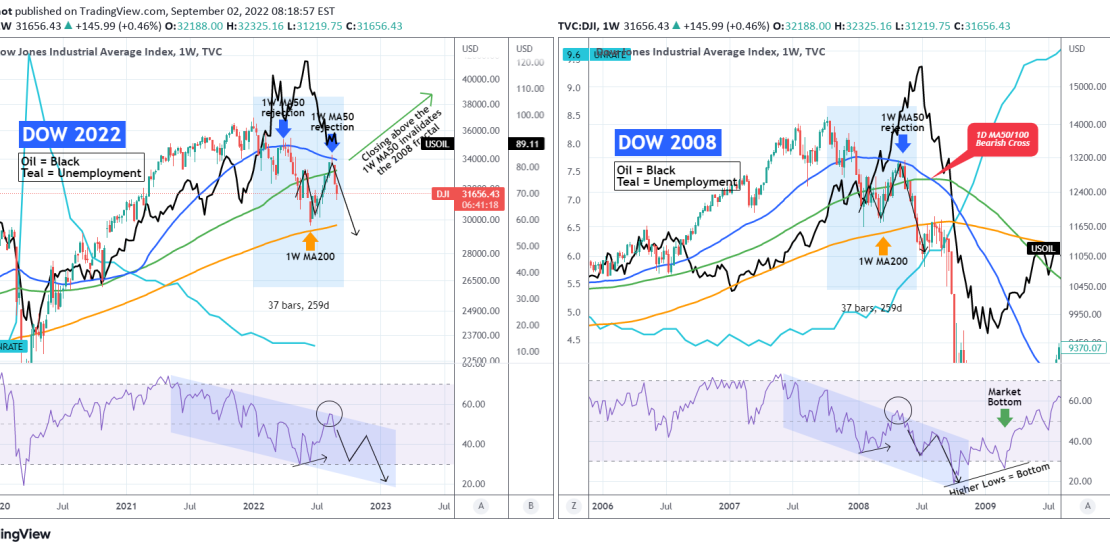
I’ve made many comparisons of Dow Jones’ (DJI) 2022 Bearish Price Action with past Bear Cycles but being near closing its 3rd straight red 1W (weekly) candle since the August 15 rejection on the 1W MA50 (blue trend-line), it is time to update it. As you see, this is a comparison of Dow’s 2021/2022
-
S&P500 got rejected as expected. Now testing the first Support.
- August 29, 2022
- Posted by: Tradingshot Articles
- Category: Stock Indices
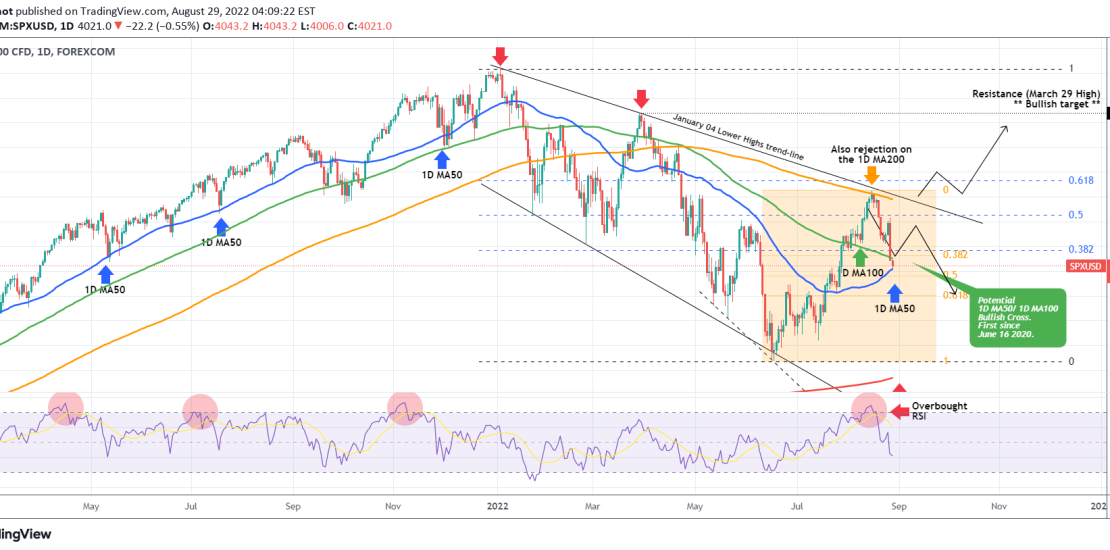
The S&P500 index (SPX) had a strong rejection on the 1D MA200 (orange trend-line), which we caught on the exact spot with our trading idea below 10 days ago: The timing on this projection couldn’t have been better, with early signs of a possible pull-back obvious as the Overbought 1D RSI has always been
-
S&P500 All time High trend-line is rejecting the uptrend!
- August 19, 2022
- Posted by: Tradingshot Articles
- Category: Stock Indices
The S&P500 index (SPX) hit 3 days ago the 1D MA200 (orange trend-line) and got rejected. But perhaps an even more important development than that is the fact that this rejection also took place on the January 04 Lower Highs trend-line, practically the Resistance trend-line that started from the All Time High (ATH). We’ve
