- August 29, 2022
- Posted by: Tradingshot Articles
- Category: Stock Indices

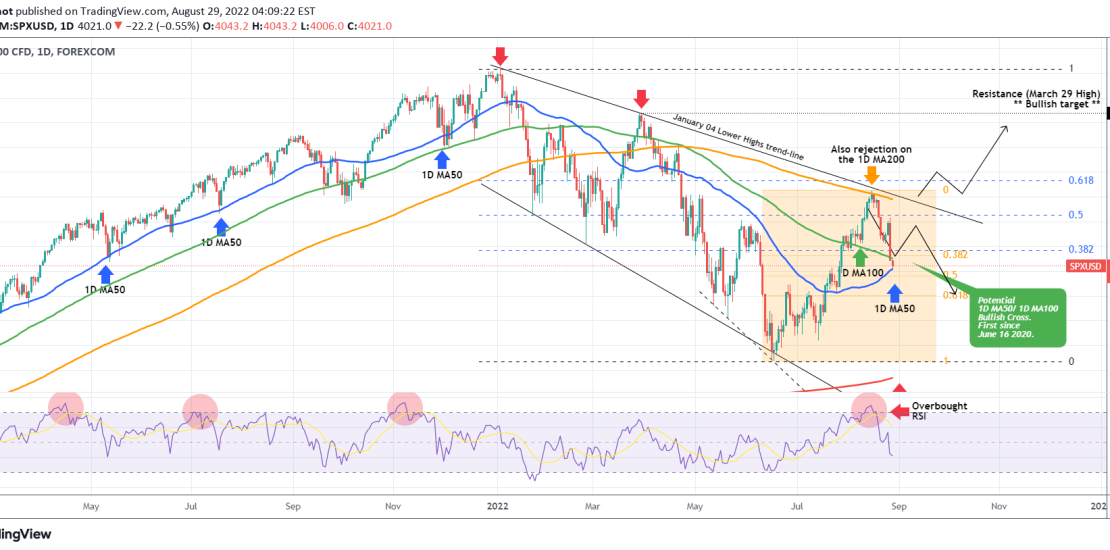
The S&P500 index (SPX) had a strong rejection on the 1D MA200 (orange trend-line), which we caught on the exact spot with our trading idea below 10 days ago:
The timing on this projection couldn’t have been better, with early signs of a possible pull-back obvious as the Overbought 1D RSI has always been a trigger for technical pull-backs ever since 2019! This is something we analyzed extensively on that analysis above, so if you want to get more insight on it, click on the idea chart.
Friday saw the strongest 1-day pull-back of this selling sequence and broke below the 1D MA100 (green trend-line) as well as the 0.382 Fibonacci retracement level and today the index hit the 1D MA50 (blue trend-line) just above the 0.5 Fib level. As mentioned on the previous analysis, since 2019 such rejections on overbought 1D RSI levels have resulted into 1D MA50 (blue trend-line) tests 5 times.
If it holds, a re-test of the 1D MA200 and the January 04 Lower Highs trend-line, which is the top of the 2022 Bearish Megaphone, is possible but unless it breaks, a new Low on the 0.618 Fib is likely.
Only a candle close above the Lower Highs trend-line should be capable of extending this strong rally since June. As mentioned on the previous analysis, we would ideally like to see a break above the 0.618 Fib (from the January 04 ATH), as this is the Golden Ratio. Two factors that strengthen the chances of a bullish break-out is that this time (as opposed to the previous Megaphone Lower High rejection), 1) the MACD on the 1W chart is on a Bullish Cross, the first since November 05 2021 and 2) the 1D MA50 is close to crossing above the 1D MA100, which would be the first such Bullish Cross since June 16 2020 that was at the start of a 1 year and a half rally (see charts below):
Tradingview link:


