

- September 26, 2022
- Posted by: Tradingshot Articles
- Category: Stock Indices
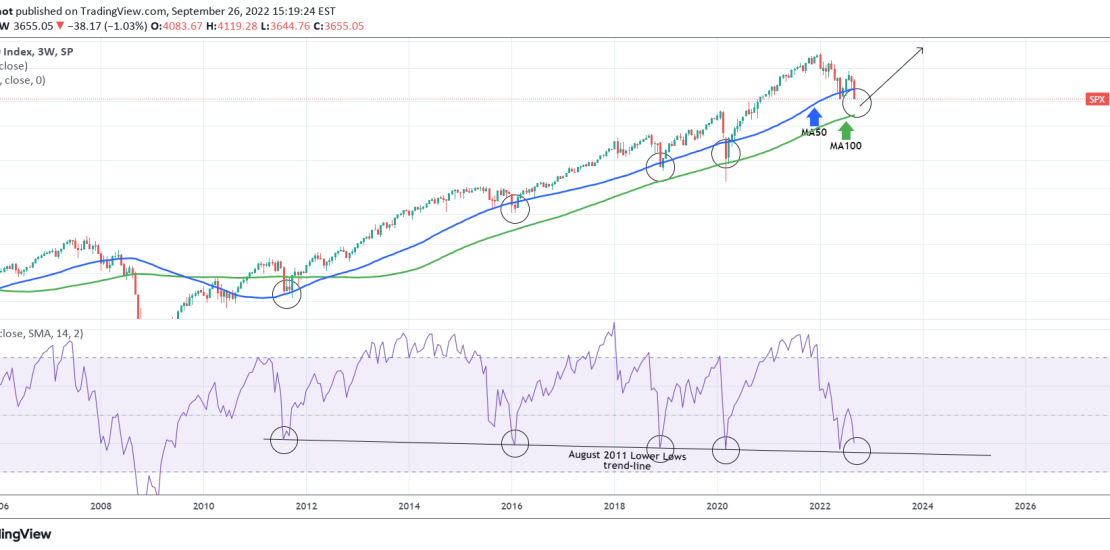
The S&P500 index (SPX) has been pulling back again considerably since the mid-August High, which still was a Lower High within the current Bear Phase. A very consistent pattern that throughout this prolonged, multi-year Bull Cycle has offered the best buy entries possible, can be seen on the 3W time-frame.
The signal is given by the 3W RSI which as you see defines almost all of the Bull Cycle since the bottom of the Housing Crisis in 2009. The pattern is a Lower Lows trend-line that started on the August 2011 Low and every time the index hit that Support, it rebounded aggressively into a new Bull Phase, thus providing the most optimal buy entry. The trend-line was almost hit on the May 31 candle, which was the first time the index hit the MA50 (blue trend-line) since May 2020 and the post COVID-crash recovery. Breaking marginally below the MA50 and then rebounding has been the norm throughout this pattern.
During the COVID crash, the RSI Lower Lows trend-line was hit on its exact level, however SPX briefly breached even below the MA100 (green trend-line) amidst this never-seen-before market panic. Can this mean that the RSI has its last Lower Lows touch in store for us with a Low closer to the MA100 again? It is possible, but what we should keep from this pattern is that if the post 2009 Bull Cycle era remains valid, then the next RSI Lower Lows trend-line touch will be as close to a perfect buy entry as it can get. And if broken, we could assume that “the last Support standing” of the Bull Cycle has finally fallen.
Tradingview link:
https://www.tradingview.com/chart/SPX/ZLBkuqce-S-P500-Is-this-the-last-Support-standing