

- October 10, 2022
- Posted by: Tradingshot Articles
- Category: Stock Indices
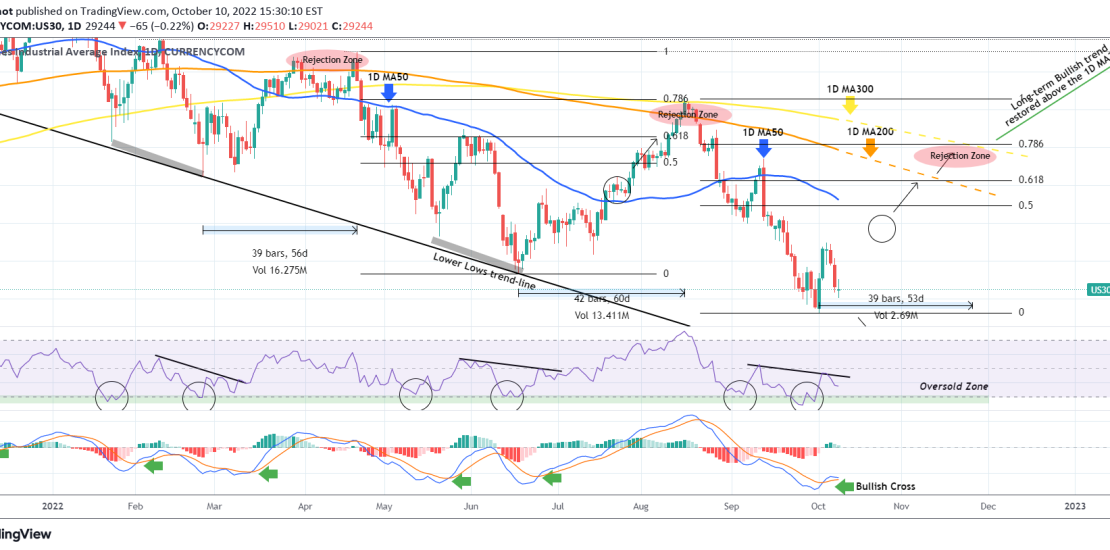
The Dow Jones Industrial Average (DJI) has been highly volatile today following a two day selling sequence on last week’s closing. Following the NFP on Friday, the market is entering the anticipation mode over this week’s CPI report, which is crucial on the Fed’s rate policy. Amidst this high volatility we have spotted a recurring pattern, which has been previously bullish on the medium-term during this year’s Bear Market.
As you see, every time the MACD formed a Bullish Cross while the RSI (both on the 1D time-frame) bounced on its Oversold Zone and made a Lower High, Dow formed a temporary Low and started a 2-month rebound. During the June – August rebound, the index reached as High as the 0.786 Fibonacci retracement level before getting heavily rejected on the 1D MA300 (yellow trend-line).
As a result, as long as last week’s Support holds, we are expecting a medium-term rebound towards at least the upper Fib levels and the 1D MA200 (orange trend-line). Short-term traders can target the 1D MA50 (blue trend-line).
Remember this doesn’t constitute a long-term trend change, which remains bearish. In order to see the sentiment reverse to bullish, we should see at least a closing above the 1D MA300. A closing below last week’s Support, should invalidate the medium-term pattern and instead extend the selling all the way to this Bear Market’s Lower Lows trend-line at least.
Tradingview link: