

- September 2, 2022
- Posted by: Tradingshot Articles
- Category: Stock Indices
I’ve made many comparisons of Dow Jones’ (DJI) 2022 Bearish Price Action with past Bear Cycles but being near closing its 3rd straight red 1W (weekly) candle since the August 15 rejection on the 1W MA50 (blue trend-line), it is time to update it.
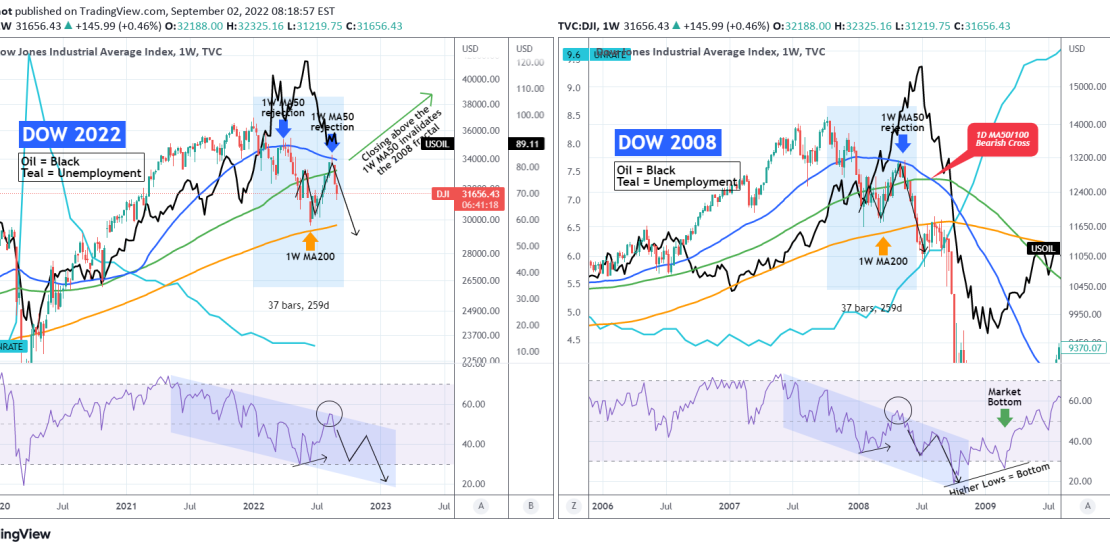
As you see, this is a comparison of Dow’s 2021/2022 chart against 2007/2008. The dynamic factor is WTI Oil (black trend-line). As you see in July 2008 Oil peaked while the index had already started it’s correction inside the new Bear Market. Dow’s 1W MA50 rejection was followed by a sharp sell-off below the 1W MA200 (orange trend-line) where the 1W MA50 crossed below the 1W MA100 (green trend-line) to form a Bearish Cross. The time that the index reached the 1W MA200 from its Market Top was 37 weeks (259 days).
At the moment the 2022 fractal looks to be following closely the 2008 sequence. If we exclude the fundamental extreme of the peak of the Ukraine – Russia war when Oil registered its peak (March 2022), its technical normalized top was in June 2022 right when Dow rebounded just before hitting the 1W MA200. See how even the 1W RSI sequences are identical so far. What this indicates is that Oil can continue dropping as the Fed attempts to lower an out of control inflation, but still stocks can fall along with it, just like it happened from mid 2008 to early 2009.
As a result, the 1W MA50 rejection seems so far consistent with mid-phases of a Bear Cycle. Fundamentally, a big factor that is not consistent with the 2008 fractal is the strong labor market we’re currently at, with the Unemployment Rate (teal trend-line) still on market lows as opposed to the 2008 fractal, which by the 1W MA50 rejection in May 2008, it was already rising aggressively. This means that technically, a weekly candle close above the 1W MA50 can be regarded as an invalidation of the Bear Cycle fractal. Also the 1W RSI printing Higher Highs can be taken as such.
What do you think will happen next? Can Dow close above the 1W MA50 or August’s rejection will hit the 1W MA200 as per the 2008 fractal?
P.S. Because the chart has the added elements of WTI Oil and the Unemployment Rate plotted and pinned to scales B and Z, it is not constant and may appear distorted based on your screen’s/ browser dimensions. The original looks like this below, so if yours doesn’t, adjust the vertical/ horizontal axis in order to make it look like this and better understand what is illustrated:
Tradingview link: