
-
DAX One last push lower for a bottom.
- February 24, 2023
- Posted by: Tradingshot Articles
- Category: Stock Indices
No Comments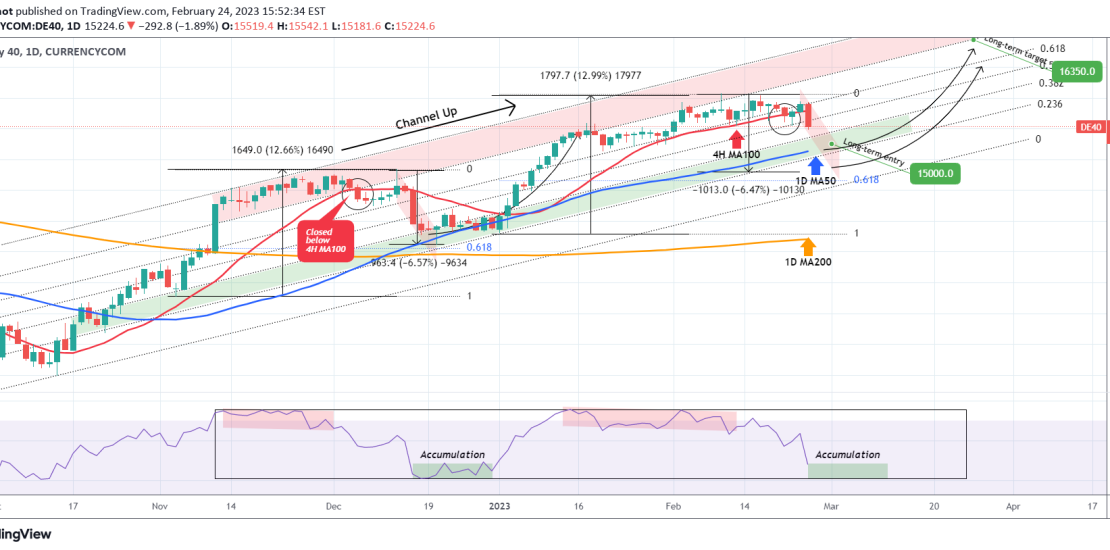
DAX has had the strongest 1D bearish candle today since December 15 2022. That was the candle that accelerated the correction from the Higher High Zone (red zone) of the long-term Channel Up to the Buy Zone (green zone). With the Channel Up pattern starting on the October 03 2022 market bottom and remaining valid
-
NASDAQ hit the 6-month symmetrical Support. Potential rebound.
- February 24, 2023
- Posted by: Tradingshot Articles
- Category: Stock Indices
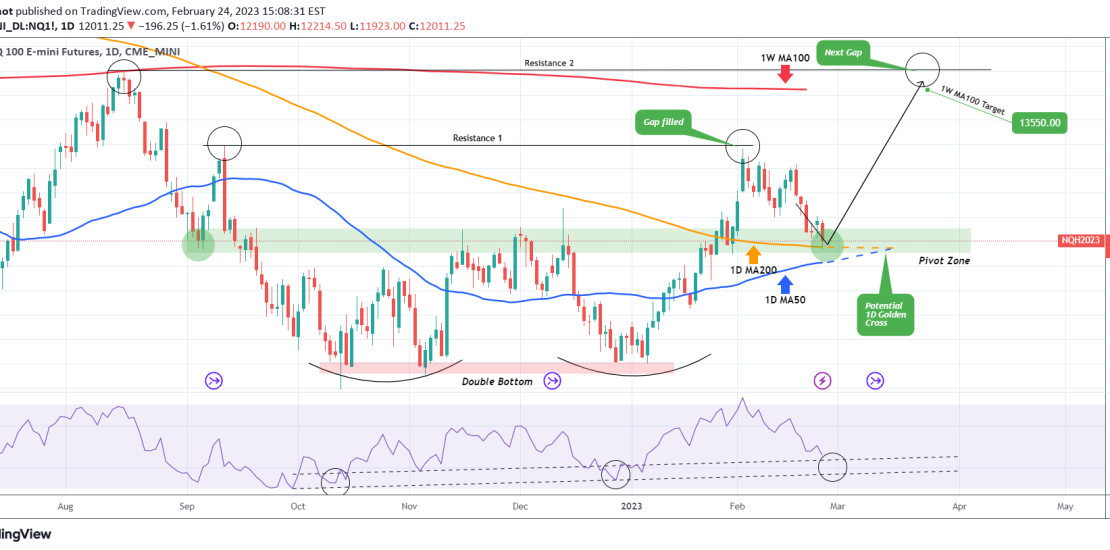
In our last Nasdaq (NDX) analysis 10 days ago, we called for a short-term correction after the price already filled the Gap of Resistance 1 (12985) and started making Lower Highs: Our target was the 6-month Pivot Zone, which is a symmetrical liquidity level, Support in early September and Resistance in mid November to mid
-
NASDAQ Potential short-term correction. The Double Bottom’s test
- February 14, 2023
- Posted by: Tradingshot Articles
- Category: Stock Indices
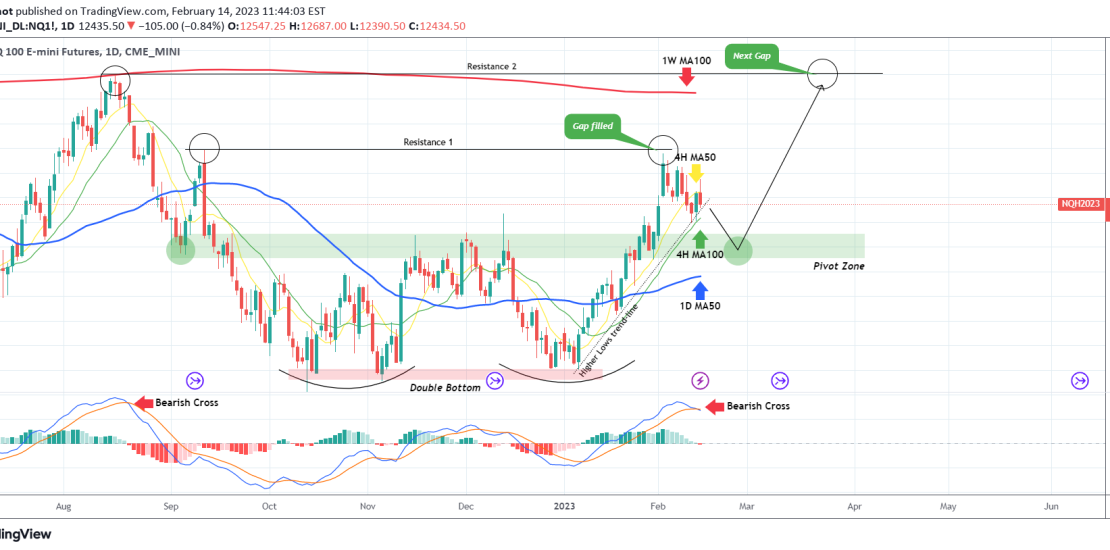
Nasdaq (NDX) broke above its 4H MA50 (yellow trend-line) today but following the U.S. CPI (higher than expected) is giving up the initial gains. We are closing the buy we made last week (as shown below) exactly at the short-term bottom on the Higher Lows trend-line in order to secure the short-term profit: A closing
-
DOW JONES Still ranged. Keep scalping for maximum profits.
- February 13, 2023
- Posted by: Tradingshot Articles
- Category: Stock Indices
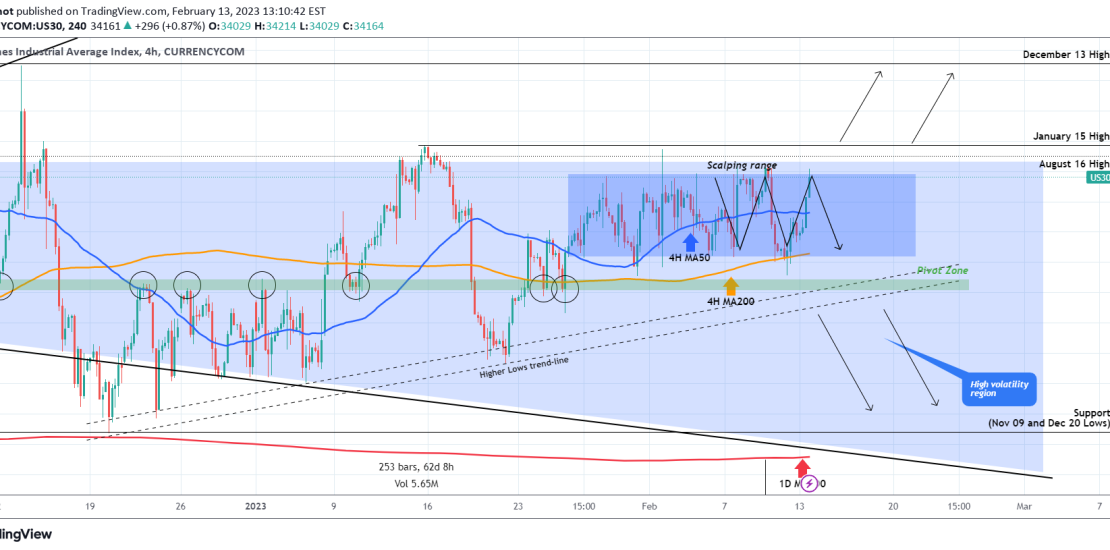
Dow Jones (DJI) followed the exact trading plan that we published last Wednesday as it rebounded on the 4H MA200 (orange trend-line) and today reached the Resistance Zone of 34300 – 34370(August 16 and January 15 Highs respectively). This keeps it neutral as we expected within the rough 33640 – 34180 Scalping Range: The 4H
-
NASDAQ 1st closing above the 1W MA50 in more than 1 year!
- February 7, 2023
- Posted by: Tradingshot Articles
- Category: Stock Indices
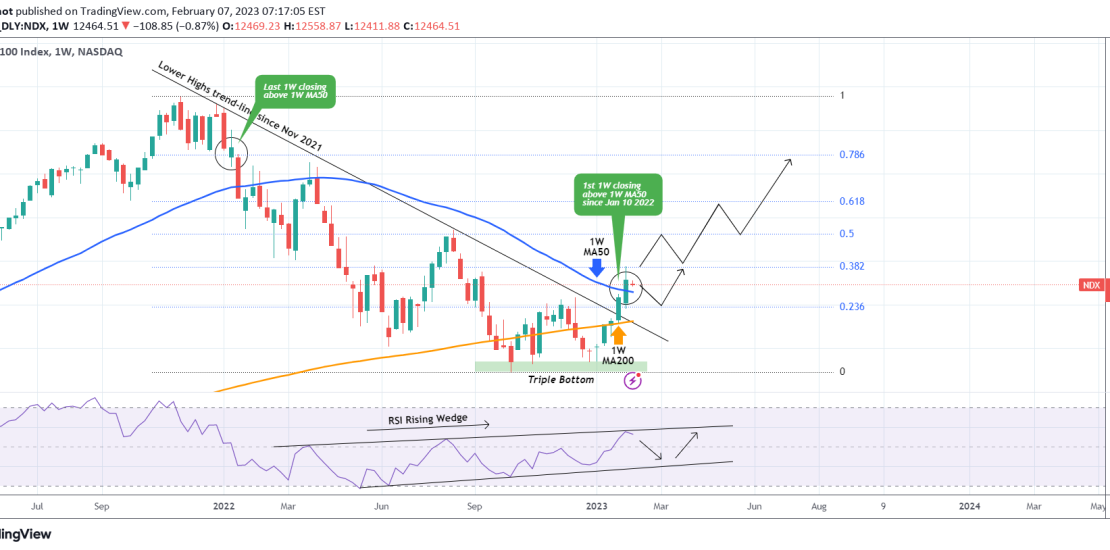
Nasdaq (NDX) closed last week above the 1W MA50 (blue trend-line) for the first time since the week of January 10 2022, so effectively for more than 1 year. On this analysis we diverge from our usual 4H – 1D time-frame analysis such as the recent one below, and look into the bigger picture on
-
NASDAQ holding the 1 month pattern
- January 30, 2023
- Posted by: Tradingshot Articles
- Category: Stock Indices
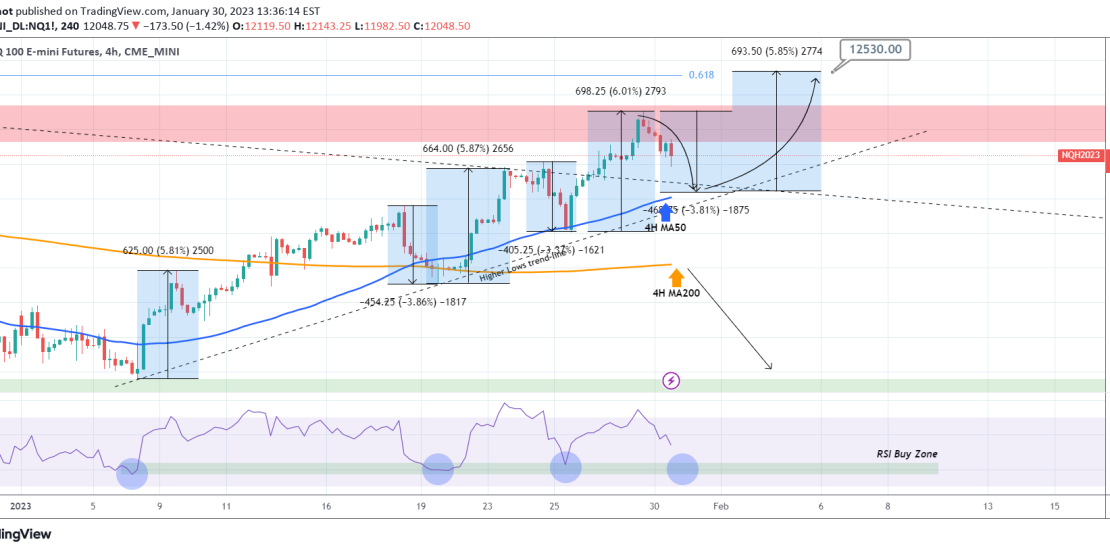
Nasdaq (NDX) is pull-back following Friday’s high. This is nothing more than a technical 1-month pattern which, supported by the 4H MA50 (blue trend-line) is posting rises around +6% and pull-backs around -3.5%. The 4H MA50 is currently a little over 11800 and a -3.80% pull-back (max on the pattern) can make exact contact with
-
DOW JONES The High volatility zone continues to pay off
- January 19, 2023
- Posted by: Tradingshot Articles
- Category: Stock Indices
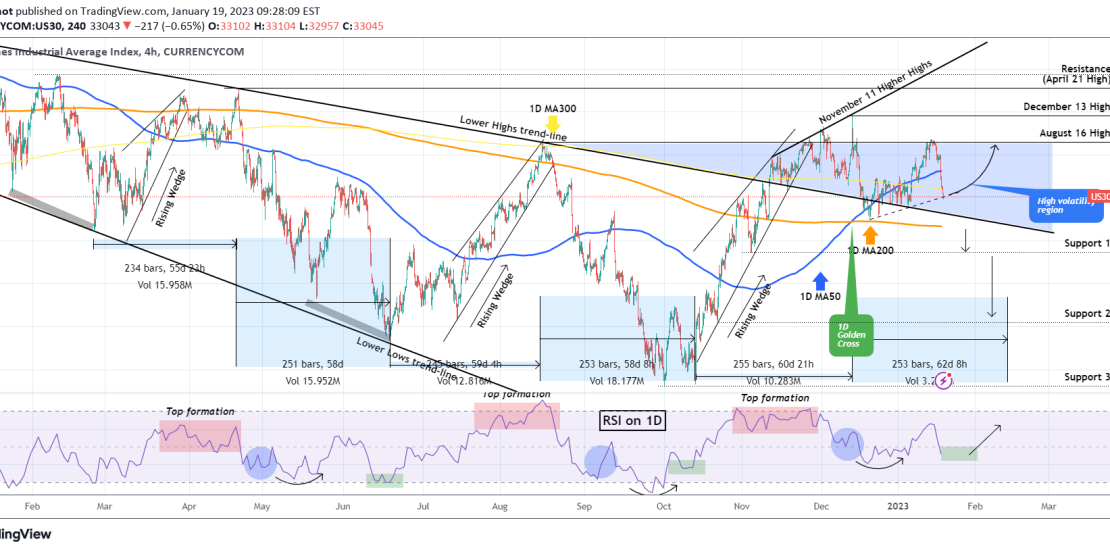
The Dow Jones Industrial Average (DJI) followed our previous call (almost) 3 weeks ago to perfection as after trading within the Triangle, it broke to the upside and hit the 34300 target: The strong rejection of this week simply validates the argument that we’ve made since November, that the blue zone will be a High
-
FTSE going to beat major indices and close the year in gains?
- December 28, 2022
- Posted by: Tradingshot Articles
- Category: Stock Indices
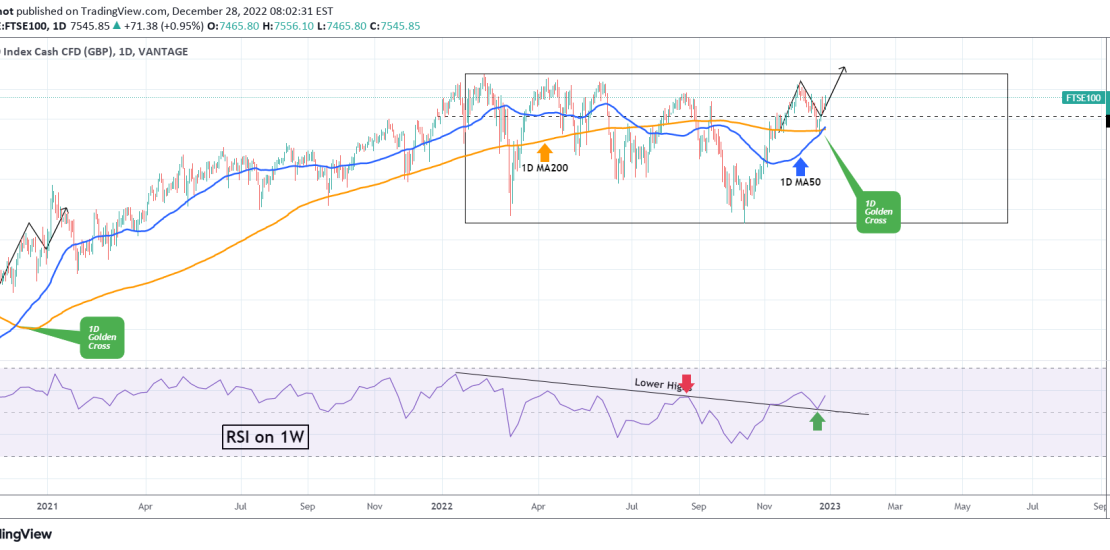
The FTSE100 index (FTSE100) has resumed its bullish trend since the October 13 bottom after hitting both the 1D MA50 (blue trend-line) and 1D MA200 (orange trend-line) on December 20. In fact, against all odds during this inflation crisis and in contrast to its heavy stock index counterparts, it is about to close the year
-
DAX Can dip even lower with the RSI being the key
- December 16, 2022
- Posted by: Tradingshot Articles
- Category: Stock Indices
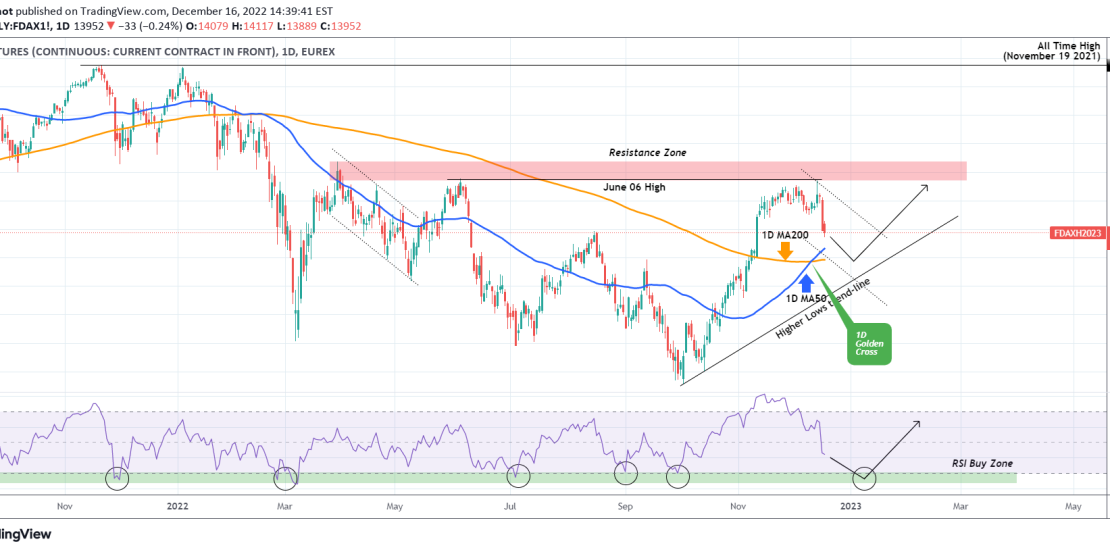
The German stock index (DAX) has had a strongly bearish week as it got rejected just below the 14700 June 06 High, inside the greater Resistance Zone that is holding since March 29. As we mentioned last week, this is a much needed technical pull-back following the +24.50% rise since the October 03 Low.
-
NASDAQ rejected on the 1 year Resistance! How bearish is that?
- December 14, 2022
- Posted by: Tradingshot Articles
- Category: Stock Indices
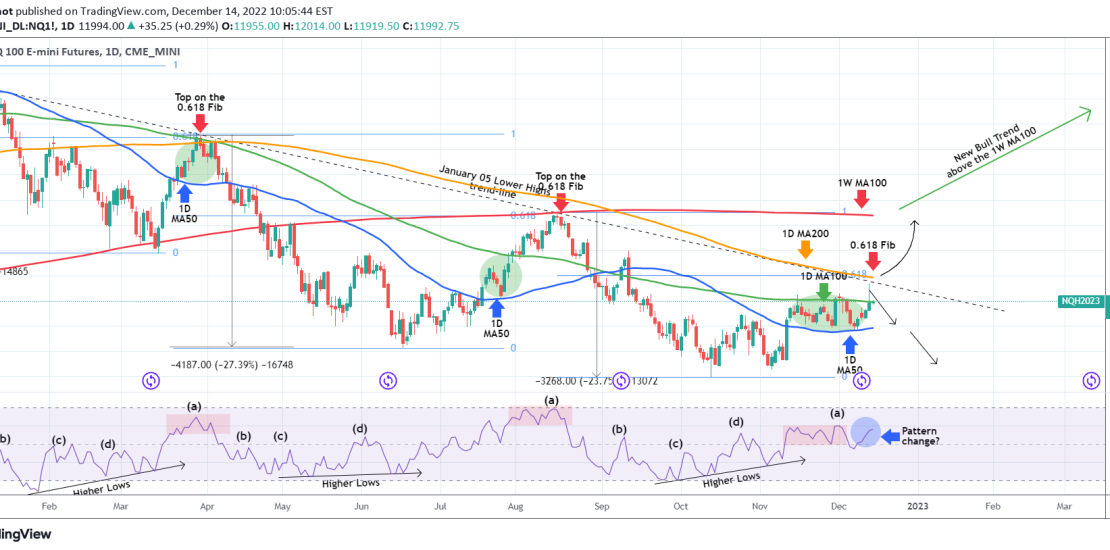
The Nasdaq index (NDX) rose yesterday aggressively after the lower than expected U.S. CPI but got rejected exactly on the 1 year Lower Highs trend-line (started on January 05), just below the 0.618 Fibonacci, as we showed on our analysis 2 weeks ago: As you see, this is the exact cluster level (Lower Highs
