

- September 26, 2022
- Posted by: Tradingshot Articles
- Category: Stock Indices
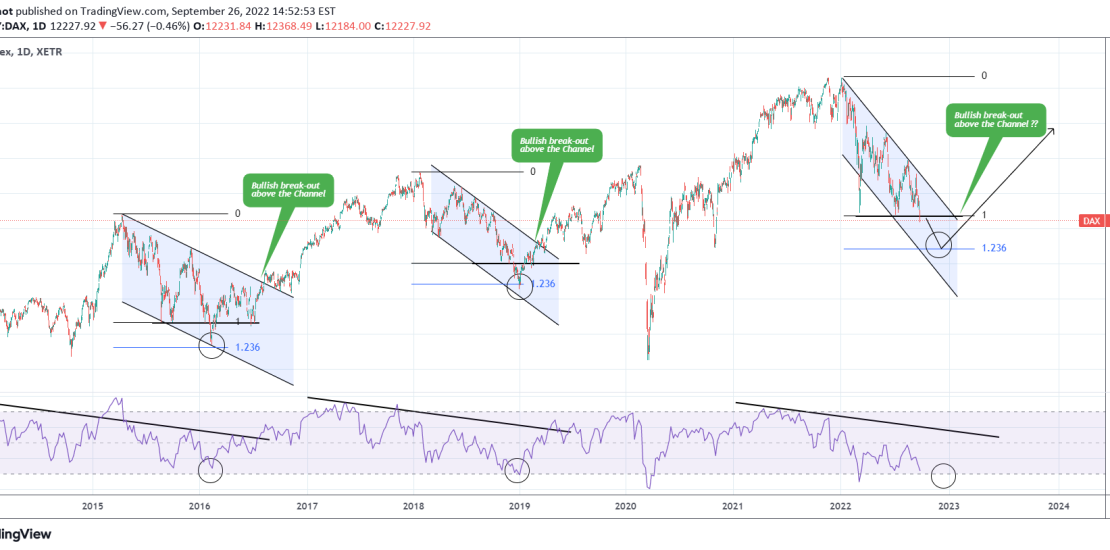
The German stock index (DAX) has been trading under Lower Highs ever since the late December All Time High (ATH). Ignoring the March 08 2022 breach due to the Ukraine – Russia war, the pattern is a Channel Down. The last two times DAX traded within a Channel Down was for the whole year of 2018 and April 2015 – July 2016. Both correction were almost a year and took place due to bearish fundamentals (U.S. – China trade war and Brexit, Grexit, VW scandal Oil respectively).
Both previous Channel Down patterns made their bottom on the 1.236 Fibonacci extension from the previous Lower Low. If we apply this on the current Channel Down, we get the 1.236 Fib a little over 11400. That is roughly the low of the November 2020 U.S. Presidential election.
In all patterns, the RSI trades under Lower Highs (with the exception of the actual ATH) way before the index top (indicating that strength was lost earlier), and when the RSI broke above that trend-line, it coincided with the price breaking above the Channel Down, thus starting a new 1 year Bull Phase.
Tradingview link: