
-
DAX hit the 1D MA200, first time since the US elections!
- October 1, 2021
- Posted by: Tradingshot Articles
- Category: Stock Indices
No Comments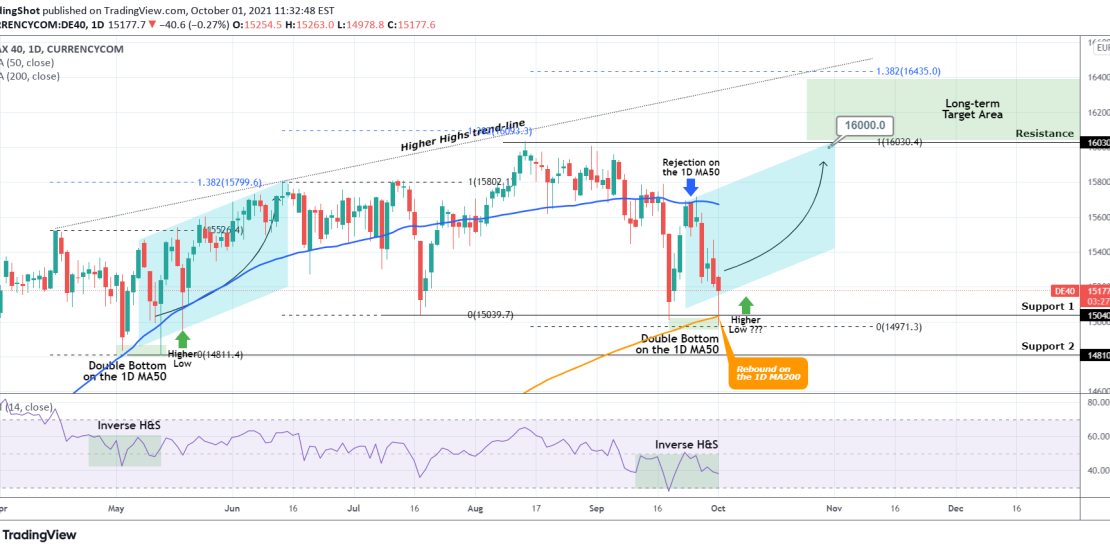
DAX hit today the 1D MA200 (orange trend-line) for the first time since November 04 2020, which was the period of the U.S. elections. That was at the start of a very aggressive end-of-the-year rally. Right now the index is rebounding after having made a Double Bottom just below the 15040 Support. If we
-
DOW JONES hit 1DMA200 for the 1st time since the US elections!
- October 1, 2021
- Posted by: Tradingshot Articles
- Category: Stock Indices
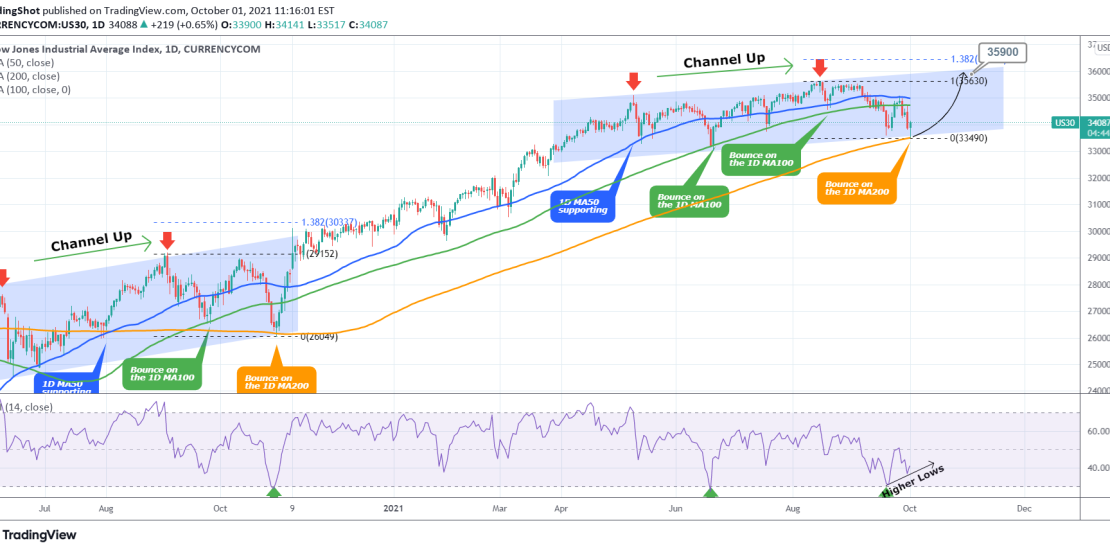
Dow Jones is trading within a Channel Up that reached today its Higher Lows trend-line (bottom). But perhaps the most important development is that in doing so, it hit the 1D MA200 (orange trend-line) for the first time since October 30 2020 (the U.S. elections)! That alone is a strong buy signal itself but
-
S&P500 Ichimoku turned red but is it a bearish signal?
- October 1, 2021
- Posted by: Tradingshot Articles
- Category: Stock Indices
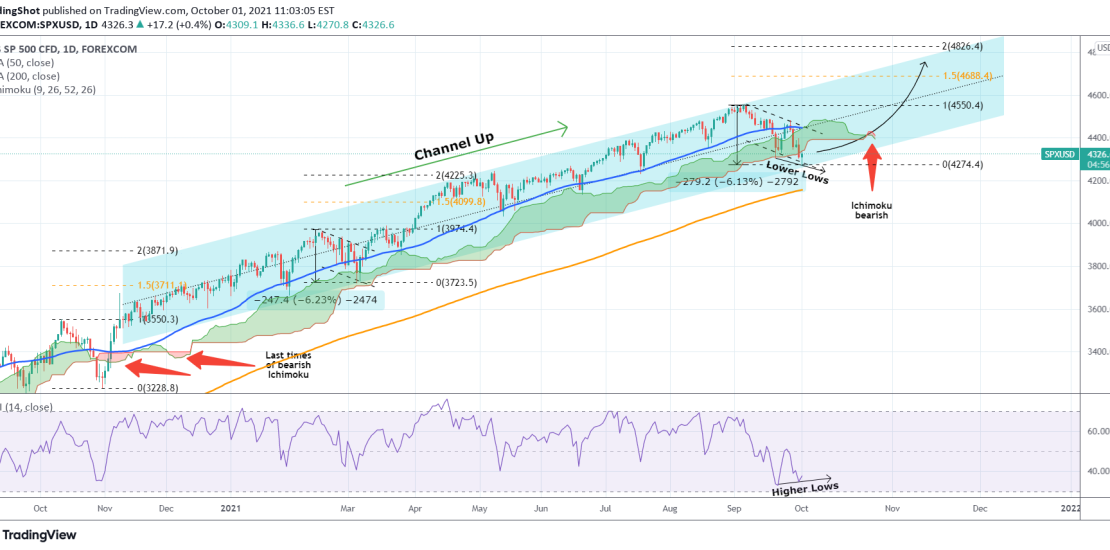
S&P has been trading within a long-term Channel Up ever since the aggressive rebound straight after the November 2020 U.S. elections. Today the price just hit the bottom (Higher Lows trend-line) of that Channel. There are two high probability scenarios arising after September’s pull-back: a) This pull-back is similar to late February – early
-
DAX Buy Signal
- September 22, 2021
- Posted by: Tradingshot Articles
- Category: Stock Indices
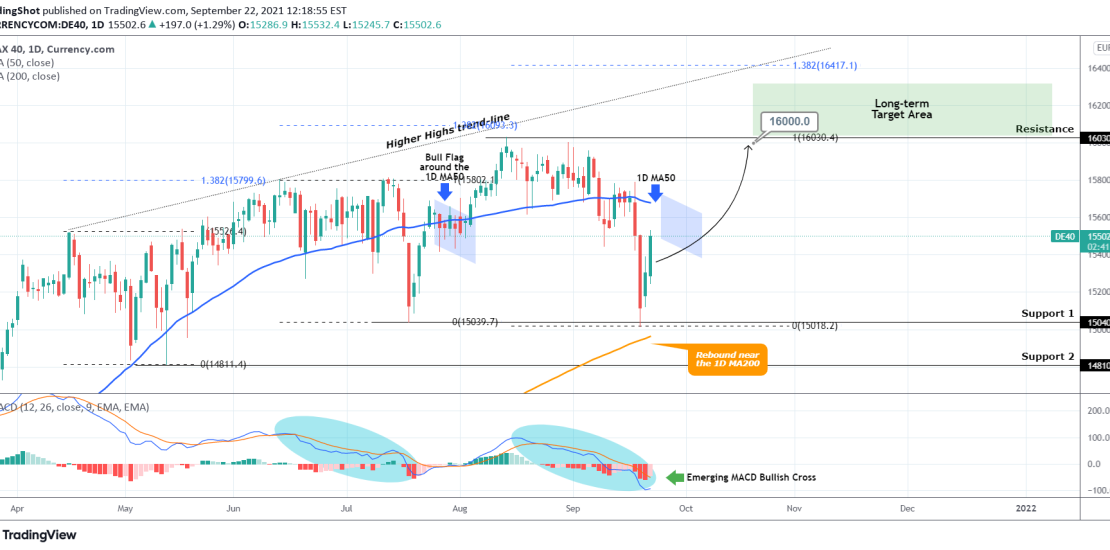
DAX is rebounding after approaching two key pressure levels: the 1D MA200 (orange trend-line) and the 15040 Support (1). Last time the price rebounded on the level, it topped at 16,030 (current Resistance) after consolidated within a mini Bull Flag around the 1D MA50 (blue trend-line). The Flag signal is the MACD Bullish Cross
-
DOW JONES near the 1D MA200/ first time since October 2020!
- September 21, 2021
- Posted by: Tradingshot Articles
- Category: Stock Indices
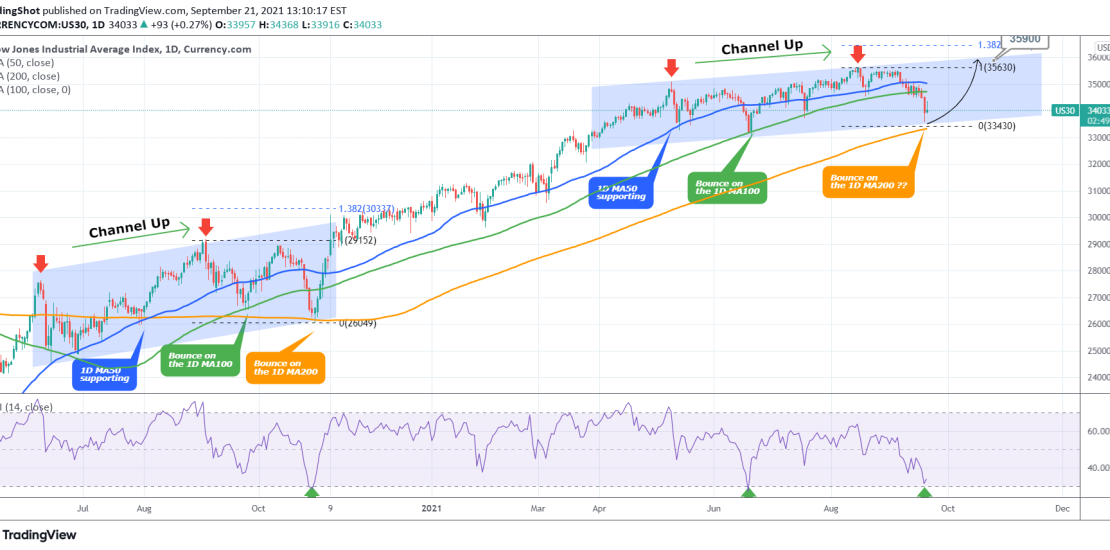
Dow Jones is trading within a Channel Up that has recently broken below the 1D MA100 (green trend-line). This is the first time in two months that is giving the first strong buy signals: * The RSI is near the 30.000 level which has marked price bottoms on June 18 2021, October 29 2020
-
NASDAQ Start looking for a buy near the 1D MA100 after the Fed
- September 21, 2021
- Posted by: Tradingshot Articles
- Category: Stock Indices
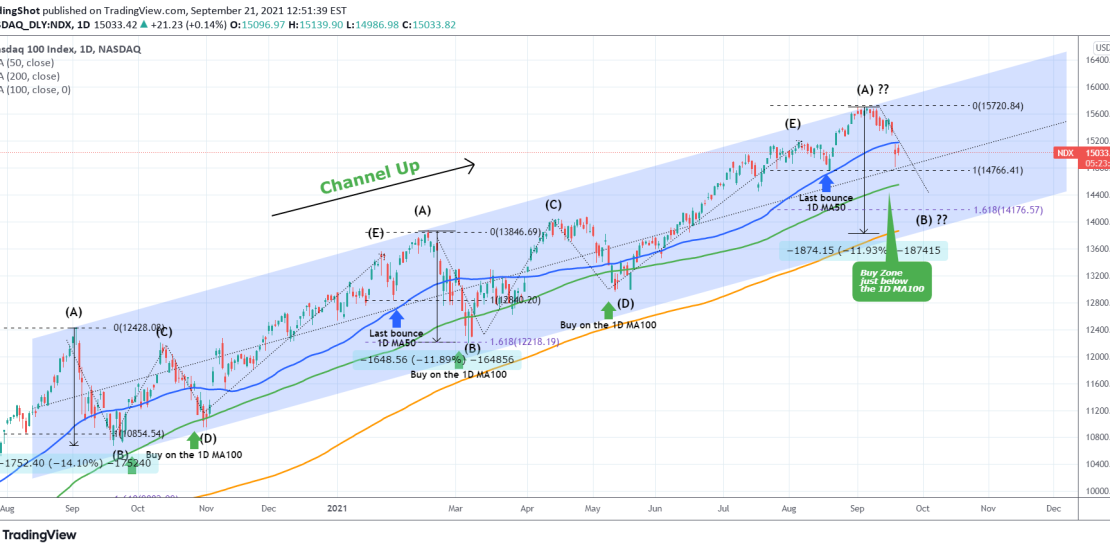
Two weeks ago NDX formed a peak formation at the top of the multi-month Channel Up (Higher Highs) and I posted the following chart calling for a strong correction: As you see that correction is currently underway and having broken below the 1D MA50 (blue trend-line) is looking for the patterns strongest Support, the
-
NASDAQ initiating a strong correction?
- September 8, 2021
- Posted by: Tradingshot Articles
- Category: Stock Indices
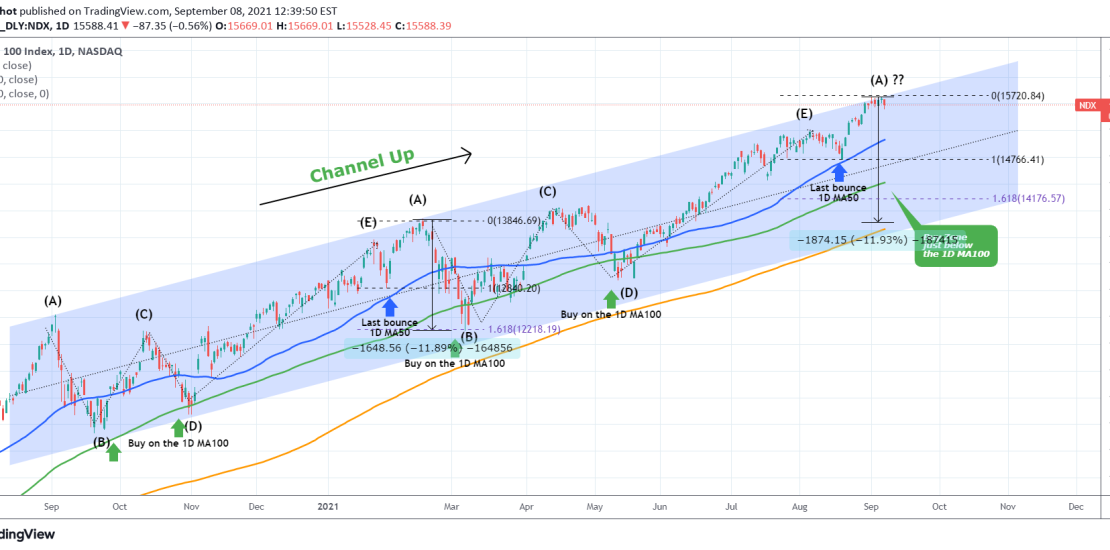
This idea is a continuation to my analysis posted on August 26: It appears that the leg count and the similarities (so far) of the current price action with the January-February sequence was correct. If the pattern continues to replicate in the same way, then Nasdaq is ahead of a strong correction as this
-
FTSE 2017 fractal points to a 7500 top
- August 12, 2021
- Posted by: Tradingshot Articles
- Category: Stock Indices
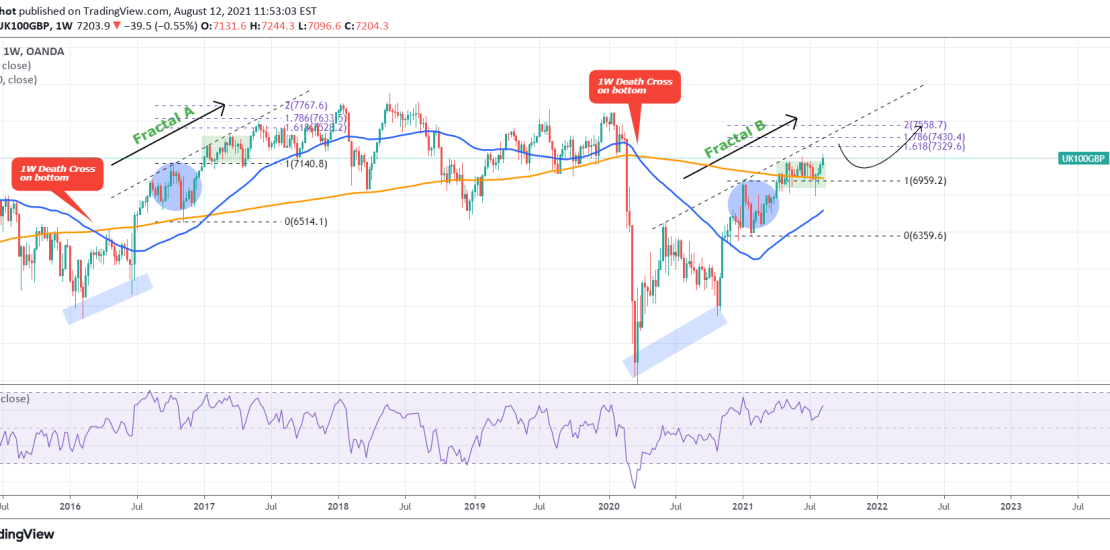
This is a fractal analysis on FTSE from 2017. Not much description is needed here, the chart is quite straightforward. The 2020-2021 (Fractal B) price action so far is similar to the 2016-2017 (Fractal A) sequence. They both started after the market bottomed out on a 1W Death Cross and have been rising with
-
S&P500 Buy opportunity on the 1D MA50
- July 19, 2021
- Posted by: Tradingshot Articles
- Category: Stock Indices
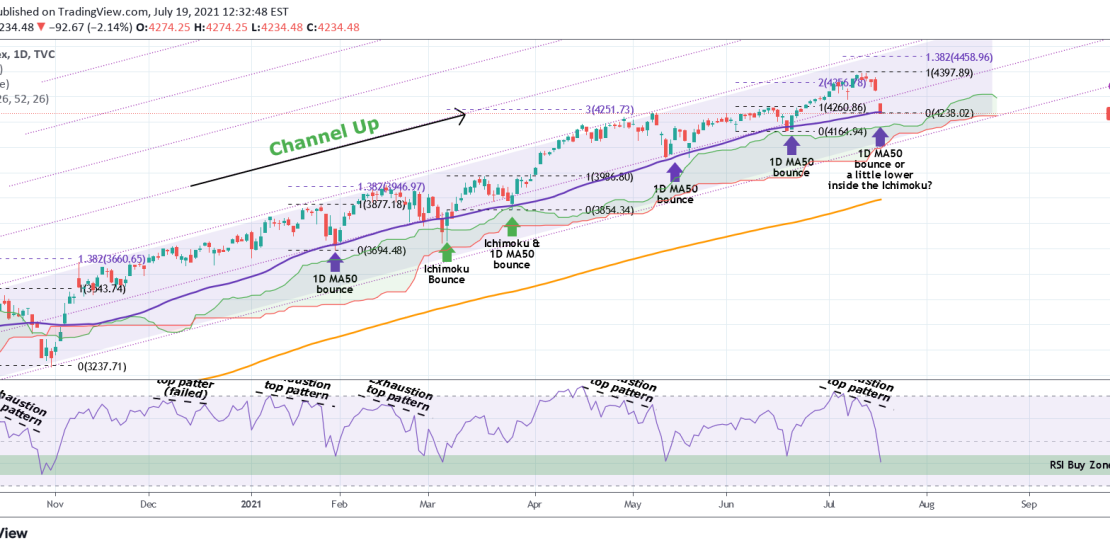
This is a continuation idea to the most recent one: Pattern: Channel Up on 1D. Signal: Buy as the price hit the 1D MA50 (blue trend-line) and the RSI has entered its 1 year Buy Zone. Target: 4450 (the 1.382 Fibonacci extension, which has been the most modest target for a Higher High within
-
S&P500 Is it getting ahead of itself?
- July 13, 2021
- Posted by: Tradingshot Articles
- Category: Stock Indices
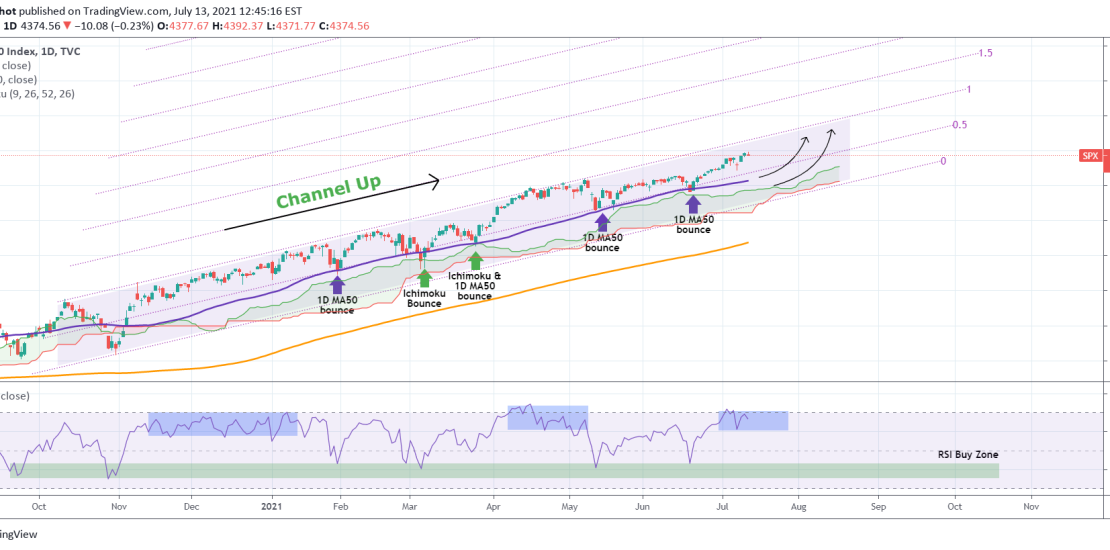
The index has been trading within a Channel Up since the November 2020 elections. The barometer has always been the 1D MA50 (blue trend-line) mostly, where the majority of buy accumulation has been taking place. The Ichimoku Cloud is second. What we see now is the price trading very close to the Higher Highs
