

- September 21, 2021
- Posted by: Tradingshot Articles
- Category: Stock Indices
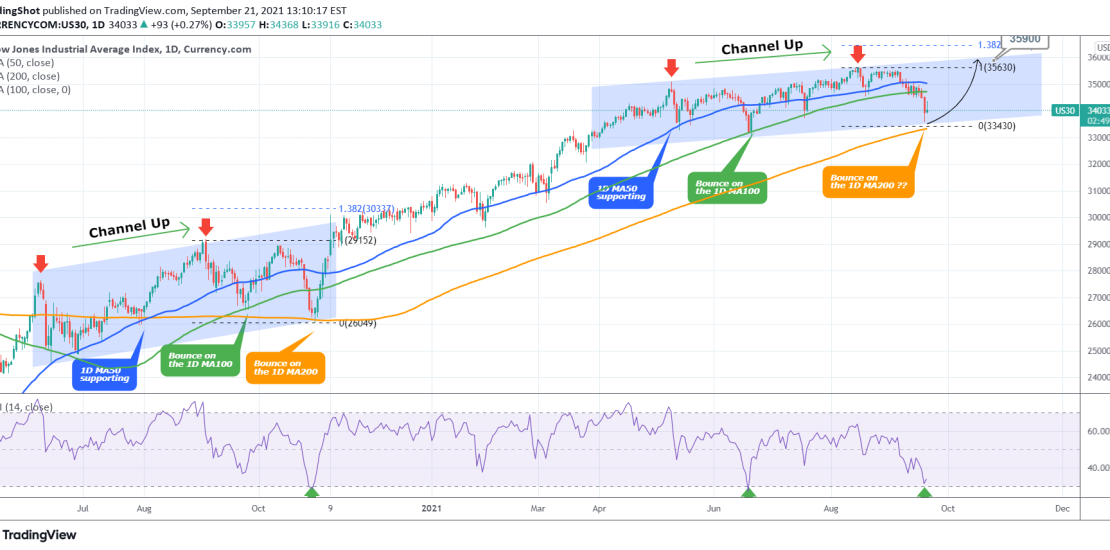
Dow Jones is trading within a Channel Up that has recently broken below the 1D MA100 (green trend-line). This is the first time in two months that is giving the first strong buy signals:
* The RSI is near the 30.000 level which has marked price bottoms on June 18 2021, October 29 2020 (in the post COVID crash era).
* The price is approaching the 1D MA200 (orange trend-line), with the last contact dating back to October 30 2020 (the line held and issued an aggressive rally post US-elections).
* The pattern resembles the June – October 2020 Channel Up. The price hit the 1D MA50 (blue trend-line), 1D MA100 and 1D MA200 in the same order and manner.
Naturally the market is waiting for Fed’s confirmation tomorrow before it engages aggressively on high volume but this is the time technically to start considering a buy entry again. Based on the Fibonacci extension model, a target of 35900 seems very plausible.
Tradingview link: