

-
S&P500 March/ April fractal points to above 4450
- June 28, 2021
- Posted by: Tradingshot Articles
- Category: Stock Indices
No Comments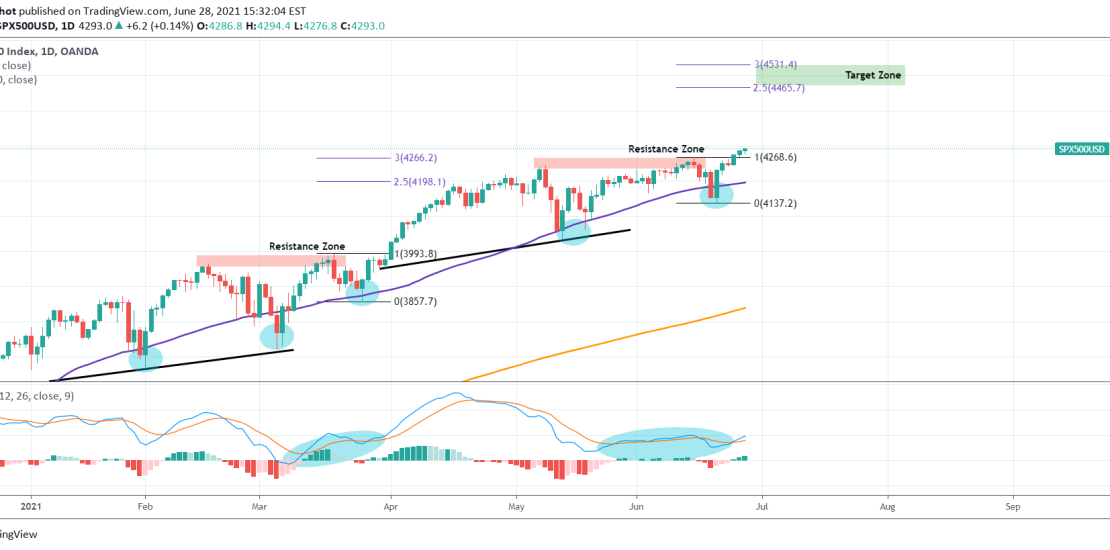
This is something I’ve also pointed out a month ago but after last week’s rebound on the 1D MA50 (blue trend-line) it got even clearer. S&P seems to be replicating the March/ April fractal where after a break-out above the Resistance Zone (on a 1D MA50 rebound), the price rallied to a level within
-
DOW JONES Is this a giant Bullish Flag?
- June 23, 2021
- Posted by: Tradingshot Articles
- Category: Stock Indices
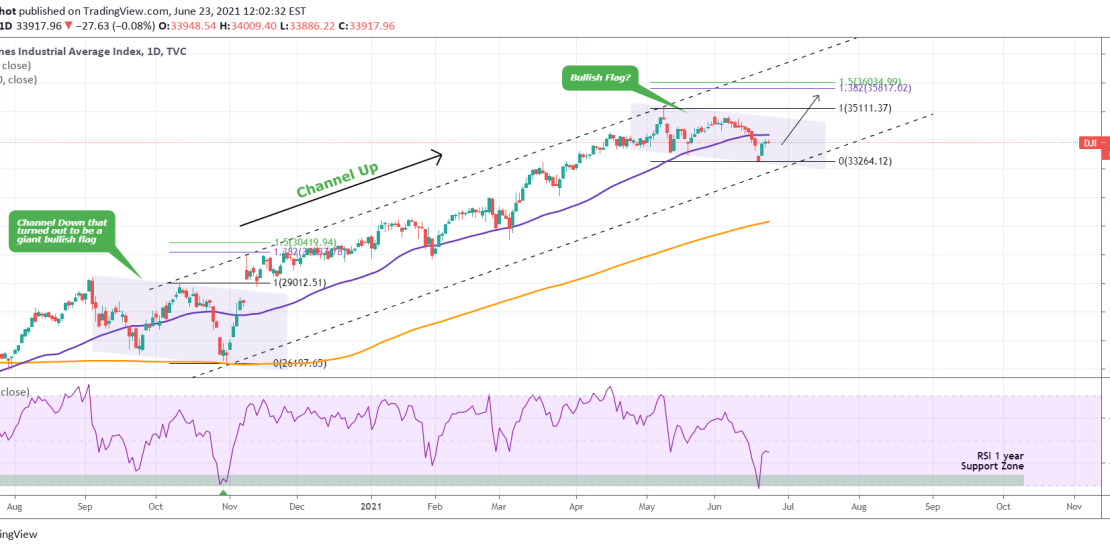
DJIA has been trading within a Channel Up since the U.S. elections last November. However since the May 10 Top, it has been trading under Lower Highs and Lower Lows which are the characteristics of a Channel Down. Last time we had such pattern was the sequence before the U.S. elections, which turned out
-
S&P500 entering a Golden Decade and no one is paying attention
- June 10, 2021
- Posted by: Tradingshot Articles
- Category: Stock Indices
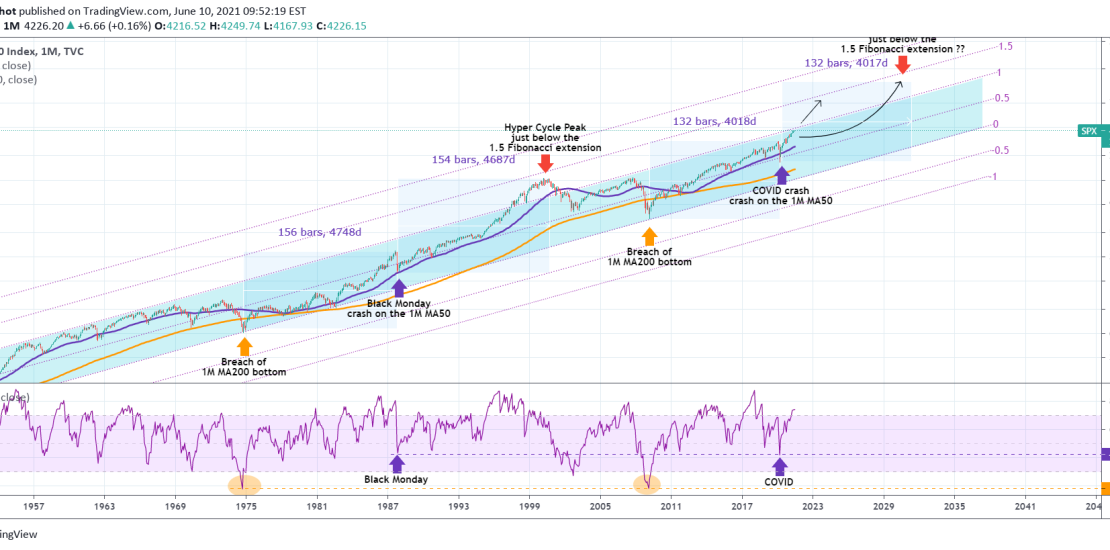
This is S&P on the log scale of the 1M (monthly) time-frame. Since the Great Depression, the index has entered a Channel Up that never stopped/ broke to the downside to this date. In particular, I have distinguished this pattern into 3 key landmarks: 1) When the price broke below the 1M MA200 (orange
-
S&P500 Triangle about to break
- June 8, 2021
- Posted by: Tradingshot Articles
- Category: Stock Indices
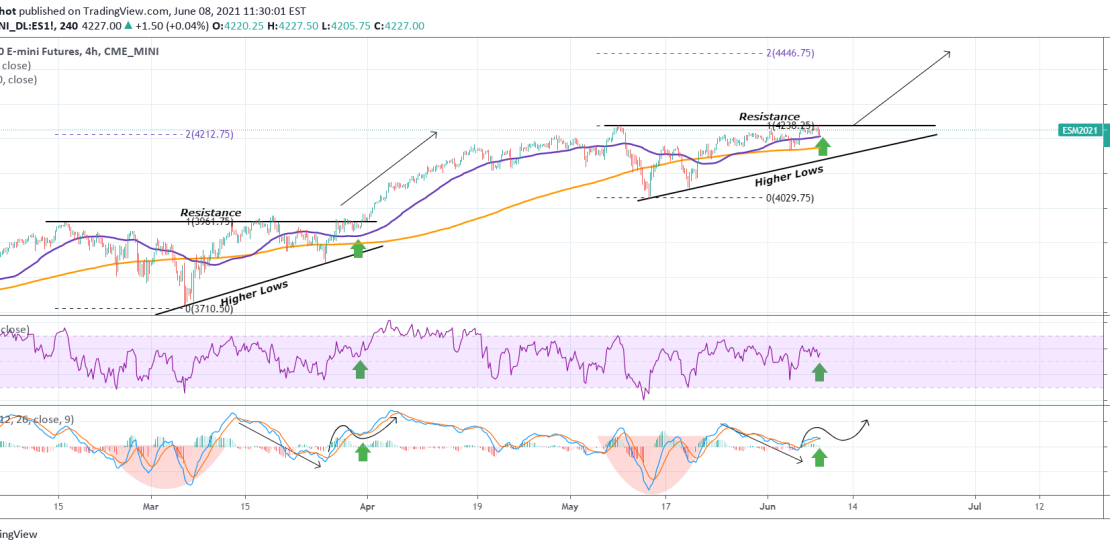
Pattern: Triangle on 4H. Signal: Buy as long as the Higher Lows trend-line holds. Target: 4400 (just below the 2.0 Fibonacci extension, similar to the March 31 break-out). Tradingview link: https://www.tradingview.com/chart/ES1!/uxzuriUl-S-P500-Triangle-about-to-break
-
S&P500 Fractal showing $4255 as target
- June 3, 2021
- Posted by: Tradingshot Articles
- Category: Stock Indices
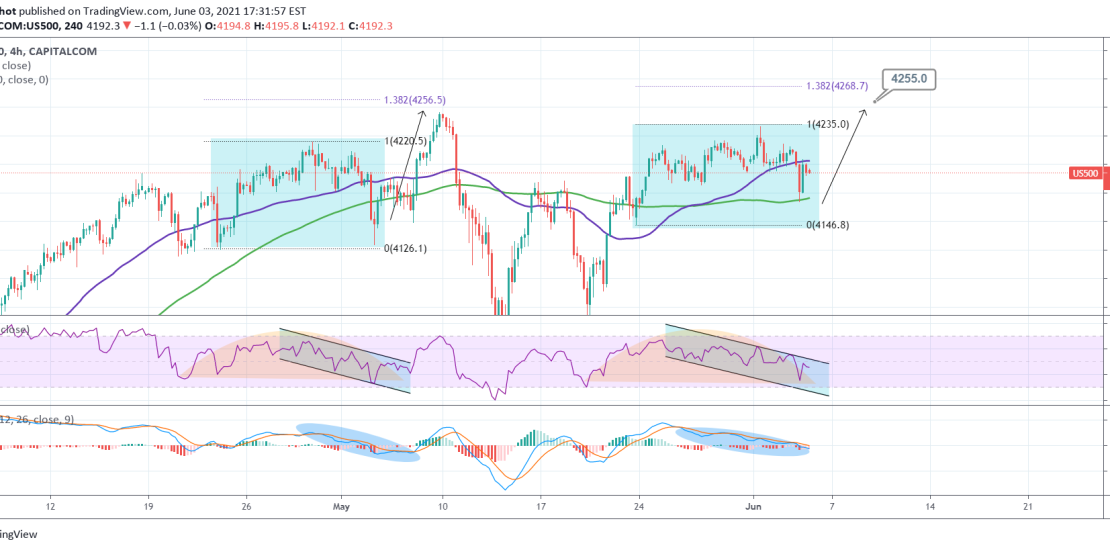
Both in terms of RSI/ MACD and the way the price trades on the 4H MA50 (blue trend-line) and the 4H MA100 (green trend-line), S&P500 appears to be replicating the late April – early May fractal. After a bottom on the Support, the price rebounded just below the 1.382 Fibonacci extension. That is currently
-
S&P500 entering the buy zone again
- May 19, 2021
- Posted by: Tradingshot Articles
- Category: Stock Indices
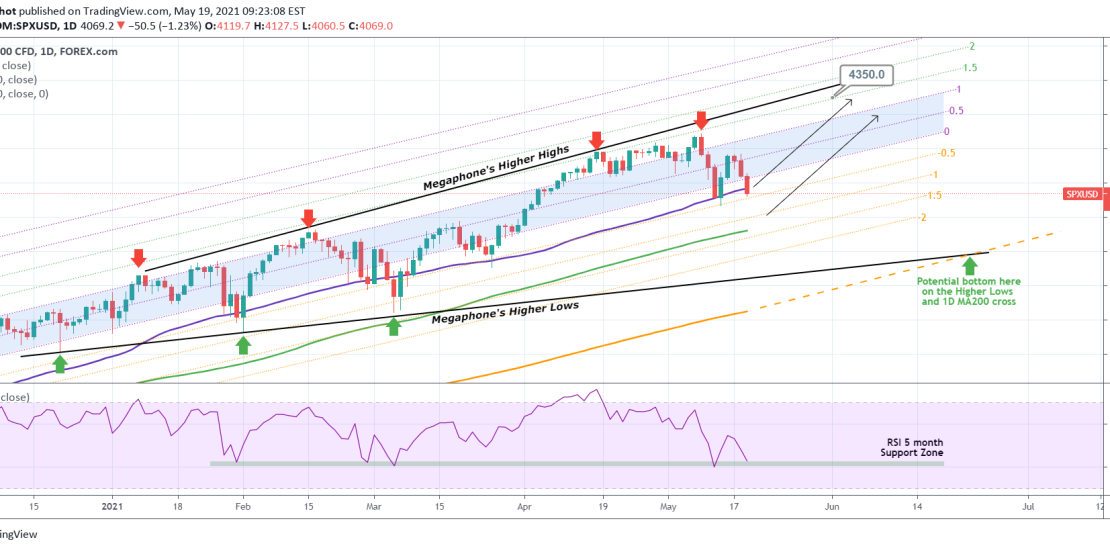
Pattern: Fibonacci Channel on 1D. Signal: Buy as the price entered the 1D MA50 – 1D MA100 buy zone again. The 1D RSI is on the (Support) similar level that it was on the Jan 29, March 04 and May 12 bottoms. Target: 4350 (the 1.5 Fibonacci extension). Previous S&P500 idea: Tradingview link: https://www.tradingview.com/chart/SPXUSD/uLhdCdCY-S-P500-entering-the-buy-zone-again
-
NASDAQ Buy Signal
- May 15, 2021
- Posted by: Tradingshot Articles
- Category: Stock Indices
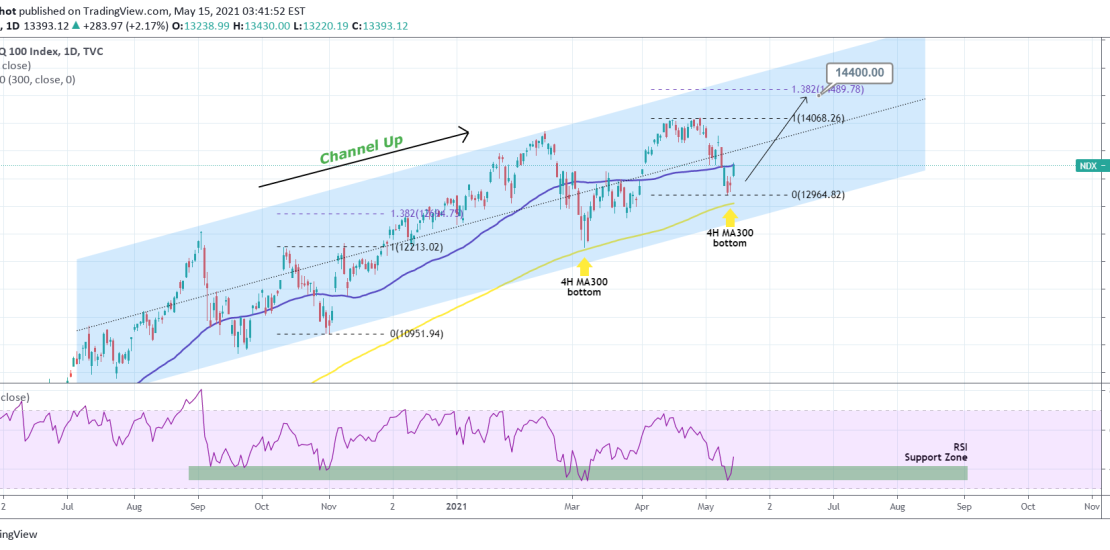
Pattern: Channel Up on 1D. Signal: Buy as the price rebounded (almost) on the 4H MA300 (yellow trend-line), which last time (March 05) formed a bottom. Also the 1D RSI hit the Support Zone that has been in effect for a year. Target: 14400 (slightly below the 1.382 Fibonacci extension). P.S. A long-term possibility
-
S&P500 First Buy Signal (medium-term).
- May 12, 2021
- Posted by: Tradingshot Articles
- Category: Stock Indices
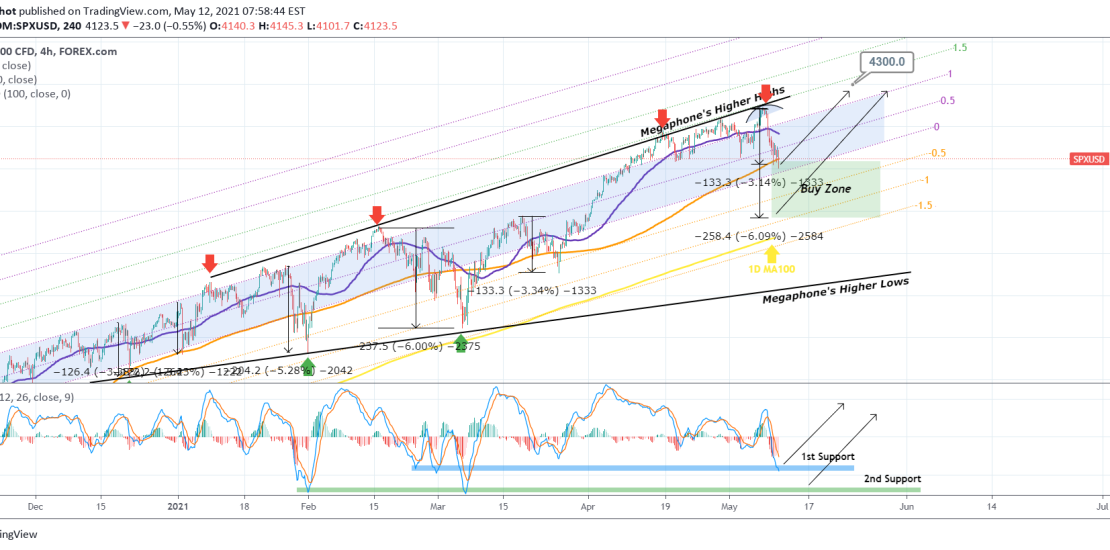
Pattern: Bullish Megaphone on 4H. Signal: Buy as the price completed a -3% pull-back. Second buy signal when it completes a -6% pull-back as since December every -3% to -6% correction was followed by a rally. Also the MACD hit its 1st Support. Target: 4300 (slightly below the 1.5 Fibonacci extension of the Channel).
-
FTSE100 Buy Signal
- April 27, 2021
- Posted by: Tradingshot Articles
- Category: Stock Indices
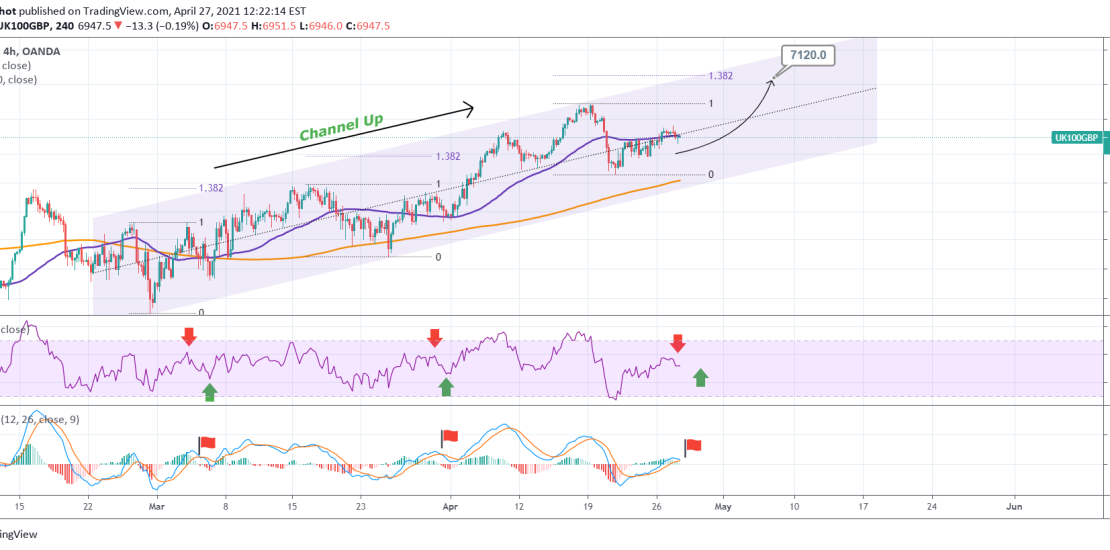
Pattern: Channel Up on 4H. Signal: Buy as the price is rising following a (near) Higher Low on the pattern. Target: 7120 (the 1.382 Fibonacci extension). Tradingview link: https://www.tradingview.com/chart/UK100GBP/Rtvk9s3s-FTSE100-Buy-Signal
-
NIKKEI a bearish long-term signal
- March 30, 2021
- Posted by: Tradingshot Articles
- Category: Stock Indices
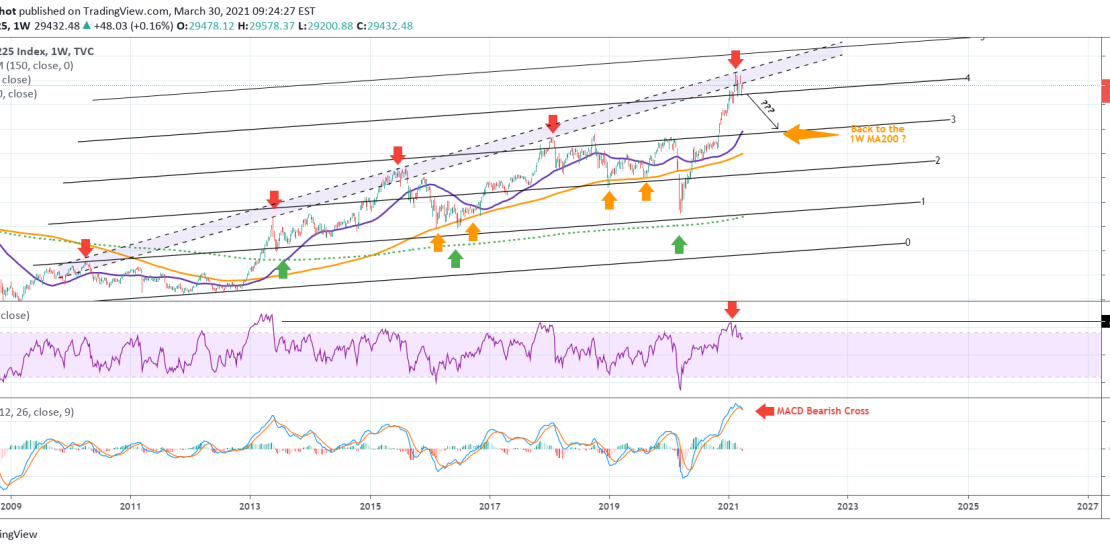
Not the most of encouraging formations for Nikkei as not only is the price struggling to break the 12-year Higher Highs trend-line (light blue zone) and has been consolidating on the 1W time-frame, but the 1W RSI is on its Resistance level too while the MACD printed a Bearish Cross. Similar occurrences in the