

- September 21, 2021
- Posted by: Tradingshot Articles
- Category: Stock Indices
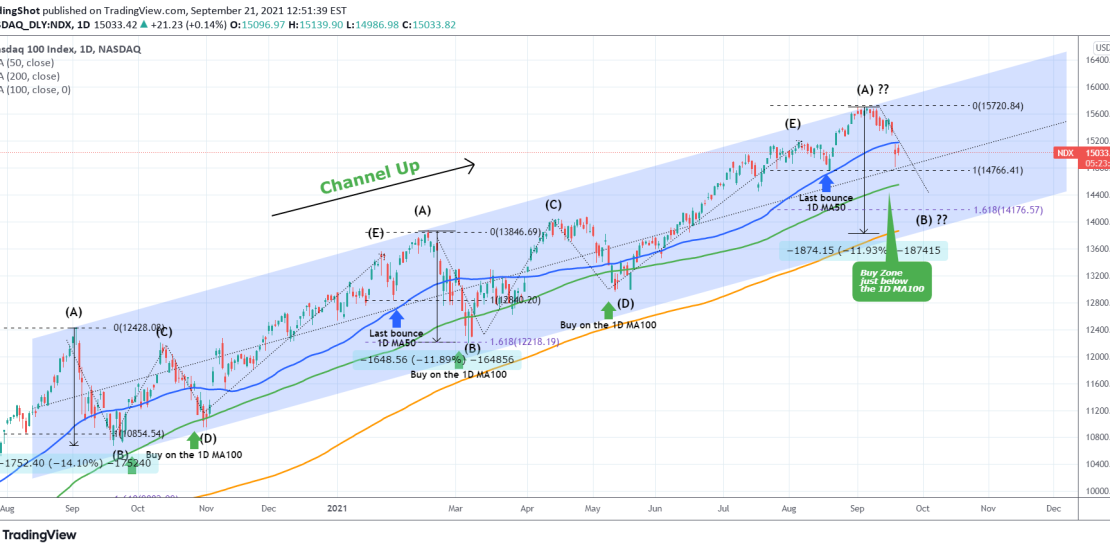
Two weeks ago NDX formed a peak formation at the top of the multi-month Channel Up (Higher Highs) and I posted the following chart calling for a strong correction:

As you see that correction is currently underway and having broken below the 1D MA50 (blue trend-line) is looking for the patterns strongest Support, the 1D MA100 (green trend-line) which has been the most optimal buy level since April 2020.
In fact more recently (March and May), the index rebounds shortly after it breaks marginally below the 1D MA100. With the Fed meeting tomorrow being crucial for the market as it either ensures the continuation of very low rate policy (bullish) or signals a start to raising rates (bearish), expect high volatility that may cross the 1D MA100 momentarily on a wick and recover quickly. If the peak I called two weeks ago is the (A) leg, then we are about to complete (B) which on a 1 year basis has been the best buy entry.
Tradingview link: