

- July 13, 2021
- Posted by: Tradingshot Articles
- Category: Stock Indices
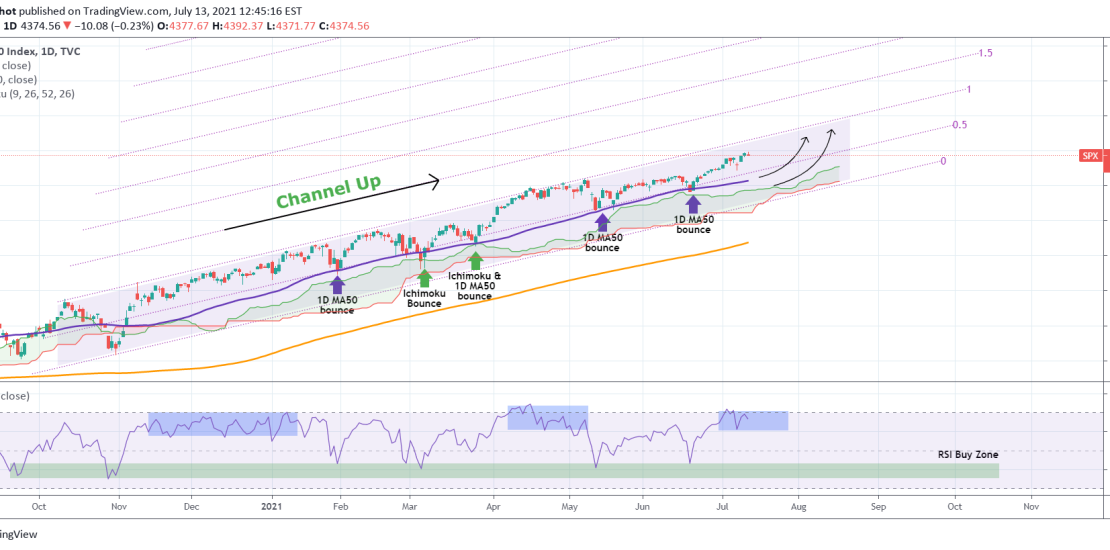
The index has been trading within a Channel Up since the November 2020 elections. The barometer has always been the 1D MA50 (blue trend-line) mostly, where the majority of buy accumulation has been taking place. The Ichimoku Cloud is second. What we see now is the price trading very close to the Higher Highs trend-line and although it can break the 4,400 – 4,420 zone and trade just under the Higher Highs trend-line for a long period of time (like Nov 2020 – Jan 2021 and April 2021 – May 2021), it is best to stay focused and use the long-term perspective as a guide. The RSI offers a good viewpoint as well, especially in terms of the consolidation near the Higher Highs, but it also has a clear 1 year Buy Zone and that is within 43.000 – 35.000.
Tradingview link:
https://www.tradingview.com/chart/SPX/QAiJmV38-S-P500-Is-it-getting-ahead-of-itself